Better Ways to Check Bolt Tension

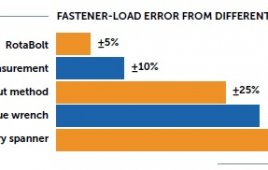
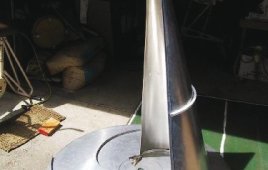
Wind turbine operations and maintenance procedures call for a 100% inspection of fastener tension after 500 hours of operation. This work is costly and can easily take a number of days to complete because each fastener is typically checked with a torque wrench to verify its proper tension.
Torque is an indirect indicator of fastener tension and bolted-joint clamp load. Numerous studies find that friction causes variations in tension accuracy by ±30%. Field tests, in fact, indicate the torque scatter to be as great as ±150%.

Fastening Graph
Fortunately, there is a faster and more accurate way to monitor tension and maintain joint clamp load. Fasteners with a “built-in tension-sensing device” can reduce these bolted joint inspections to just a few hours. Fixed maintenance cost is drastically reduced, while the accuracy of bolt tension narrows to within ±5%.
One built-in tension-sensing device is the RotaBolt, from EGC Enterprises. Fasteners with this modification provide a real-time indication of clamp load. A notable feature is that there is no need for sophisticated torque testing equipment. Users need only check the Rota-cap with a thumb and forefinger to assure themselves each fastener is properly tensioned.
It works like this: All bolts stretch or elongate when tightened. The RotaBolt takes advantage of the stretching with a gauge pin anchored inside
the fastener. When the fastener reaches proper clamp load the gauge pin pulls down on an internal disc called a Rota-load indicator and closes an air gap. The size of the air gap is proportionate to fastener elongation when properly tensioned. Closing the air gap prevents the cap from turning with finger pressure. This cap also seals out the environment and protects internal components.
Each of these fasteners is individually set to an application preload with an assured accuracy of ±5%. An installer knows he has reached the correct load when the cap no longer turns with finger-tip pressure. After installation, the load can be quickly checked at any time to assure ±5% design tension, regardless of environmental influences that can cause relaxation and clamp load loss in the bolted joint. When a cap is found to spin during fastener maintenance checks, simply retighten the fasteners to the point of cap lock-off.
The VLI or Visual Load Indicator provides another design, this one with a dial indicator at the end of the bolt or stud. A visual check of the dial indicator tells whether or not the bolt has reached its proper fastener load.
The straightforward advantages of VLI are that it gives maintenance personnel a quick visual tension check that can be performed at up to 30 feet away and greater distances with binoculars. If line of sight is interrupted, a remote camera can easily provide a closer eye. VLI also provides indication of tension overload as well as under load conditions. To check a VLI bolt, simply look at the indicator face. If the bright yellow tension indicator stripe is hidden on the black face, clamp load remains assured within ±5%. If the yellow tension indicator stripe appears, the fastener needs maintenance.
All fasteners are affected over time in service by temperature changes, joint relaxation, pressure fluctuations, and vibration. The Rotabolt and VLI indicate changes in bolted joint clamp load and integrity by monitoring the tension of each fastener. Adding these indicators to key wind-turbine fasteners significantly reduces scheduled time for maintenance and fixed costs while improving bolted joint safety and durability. It is no longer necessary to retighten every fastener.
What’s more, RotaBolt tension validating fasteners are approved by Germanischer Lloyd. To participate in a field validation trial of RotaBolt or VLI bolts, contact the company at (800) 342-0211.

::Windpower Engineering::

Wind Kite Concept could Generate Plenty of Power

September 21, 2009 by WindPower Engineering  
Filed under Wind Watch

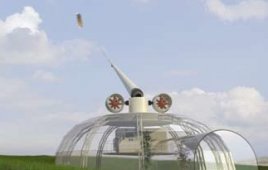
Nobody can accuse Italian wind-turbine designers of not thinking big. They say conventional wind turbines just scratch the surface in a few favorable locations on what is an enormous energy field. Current designs cannot reach upper altitude winds and are close to dimensional limits. For instance, there is difficultly positioning hubs at over 100 m up, towers grows exponentially heavier and more unstable than previous designs, and above all, they are more expensive with height. Now consider that the flight-prohibited area over a nuclear power plant can easily contain 1 GW of wind power, equal to the power the plant generates. You’re getting the picture.
windwatchkite2To reach wind over 500 m and exploit its greater kinetic energy, the Kite Gen project starts from a change of perspective: no heavy designs like current wind turbines, but instead, light and dynamic structures. To extract energy from an altitude of 800 to 1,000 m, this design suggests using power kites, semi-rigid automatically piloted high efficiency air foils. All the heavy machinery for power generation remains on the ground. Two cables connect each the kites to a winch to control the kite’s direction and angle to the wind. The winches then sit on a large-diameter carrousel.
The Kite Gen concept is comparable to a wind turbine in that the blade tips are the most efficient part of a rotor, say proponents, because they reach highest speeds. The generator is then conveniently located on the ground. The resulting structure is much lighter and cheaper than a conventional design. Moreover, a kite’s operating height can be adjusted to wind conditions.
Several winches or kite steering units, pilot the kites over a predefined flight path. A video at kitegen.com shows some detail. The power kite is maneuvered by unrolling and recovering the two lines, each on the motor-driven winch.
Each Kite Gen power plant is composed by several steering units pulled by power kites along a circular track at ground level. Control software also receives data from on-board avionic sensors to pilot the power kites, control their flight patterns, and maximize energy production.
Conventional wind turbines must be spaced to avoid shading one another which would decrease the total yield. A wind farm can require more than 40 km². In contrast, a Kite Gen power plant and a safe area around it would use about 5 km². Energy production takes place in a distributed manner from several generators thus avoiding unmanageable sizes to electrical equipment.
windwatch kiteThe modular approach makes possible to build powerful Kite Gen plants. For example, a 100 MW Kite Gen power plant, not much larger than the illustrated example, would have a ground level diameter of about 1 km and deliver an estimated energy at a cost of less than €0.03/kWh. At this writing, a 1,000 MW plant is under study. The exponential growth of the total wind power that can be harnessed is the main reason behind larger Kite Gen power plants.
Proponents say the scalability of the Kite Gen power plants comes without significant structural or cost constraints because of the design’s modularity. For example, it would allow adding steering units (winches and kites) to produce energy from a larger diameter.
In scaling up plant dimensions, one idea researchers plan to explore is converting mechanical energy into electrical energy by running linear-magnetic motors in reverse.
The theoretical boundaries of such configuration appears to be a ring of about 25-km diameter, which would be the stator on which rotates a magnetically levitated Kite Gen. The tethered high power kites in such a size would fly at up to 10 km in a controlled formation, generating more than 60 GW.

::Windpower Engineering::

CFD’s Role in the Windpower Industry

Recent advances in CFD (computational fluid dynamics) codes and the availability of large scale computer “clusters” are guiding the design work of the next generation of wind turbines. Developers should be able to model a turbine’s power output versus wind velocity, and then the power output for a wind farm with direction data. In addition, detailed information on wake turbulence and velocity deficits in large arrays of wind turbines will avoid the under-prediction of power outputs that plagued previous methods. Those are the goals. The devil, as usually, is in the details

Trouble with turbulence
As companies build larger wind turbines, they place an increased emphasis on decreased spacing distances. This gives rise to a twofold problem: Shorter distances can reduce the production from downstream turbines, and result in a significant decrease to service life due to the increased load levels created by turbulence. Field tests and simulations show that operating in a turbulent wake field can increase equipment stress levels by 5 to 15%.
Typical turbine spacing is 6 to 8 times the rotor diameter.

Yellow turbine velocity: The velocity simulation is on a plane through the hub and nacelle.  About 9 m/s wind slows a bit at the nose and behind the nacelle and speeds up at the sides.

Yellow turbine velocity: The velocity simulation is on a plane through the hub and nacelle. About 9 m/s wind slows a bit at the nose and behind the nacelle and speeds up at the sides.

The wind-resource use factor is independent of rotor diameter and ranges from 2.5 to 9 MW/km2. But a recent study shows that turbulence can be twice normal levels at 10 rotor diameters downstream, along with a 25% velocity deficit. In addition, some early indications are that the largest turbines may be particularly vulnerable to “horizontal wind shear”, which is created by the meandering wakes of upstream turbines.

Such conditions are of increasing concern to offshore developers and OEMs. To vividly illustrate the problem, Ed Salter, CTO and Co-founder of Greenward Technologies, Austin, Texas (greenward-technologies.com), points to an aerial photo of the Horns Rev  wind farm, the world’s largest offshore development. The photo shows clouds forming in low-pressure turbine wakes. The image reveals a lot. First of all, the rotating wake, referred to as “swirl”, does not dissipate quickly and extends back many rotors diameters. More importantly, the photo shows the swirl building as it passes through the rotor of each turbine.
“There are no terrain features offshore to break up the wakes, so they persist for long distances,” says Salter. “Also, they are reinforced in an additive manner at each row. Turbines operating downstream of other turbines in highly turbulent flow can experience greatly accelerated fatigue damage to all components in the primary load path.”

Could there be a way to eliminate or reduce the effects of rotor-induced wake swirl? Salter and Greenward CEO Larry Haworth think they have an answer in what they call a Quad Array. It consists of four counter-rotating turbines that feature 3-blade flexible, lightweight rotors that were first developed by Salter at Wind Power Systems Inc. in 1977. The four turbines are mounted on a streamlined “X” frame that rotates to service each turbine. The Quad Array frame also uses what Salter calls “flexible lightweight rotor technology” that almost eliminate “tower shadow” noise and vibration.

Quad Array: places four turbines on crossed arms letting their blades counter rotate to minimize turbulence.

Quad Array: places four turbines on crossed arms letting their blades counter rotate to minimize turbulence.

The wake dynamics of the Quad Array are of particular interest, and a simplified wake analysis was done in February of 2008. This was followed by the design and construction of a functional wind tunnel scale model that Salter subjected to a series of preliminary controlled velocity tests.
The results led him to formulate what he calls the Wake Convergence and Swirl Cancellation hypothesis. The concept is simple enough – get the counter rotating wakes to converge and the opposing swirls will cancel each other. The implications are not so simple. “If we can prove this, it will change the industry,” says Salter. “We could be looking at something like a 10-fold improvement in the wind resource use factor, combined with a large reduction in turbulence levels.”
To back up his comments, Greenward has launched a collaborative program to analyze the wake of the Quad Array using the latest CFD codes, along with a comprehensive wind tunnel testing program. The company is looking for qualified collaborators, and plan on presenting their first paper at Windpower 2010.

CFD1

Wakes from Discs: a detailed site analysis shows a measure of turbulence behind turbine rotors

Learning from larger machines
As OEMs design larger turbines, they are finding variations to the wind in just the area swept by the rotor. “One question is: What is the real loading on the blades?” asks Dennis Nagy, vice president of business development with CAE software developer CD-adapco, Melville, NY (cd-adapco.com). “It’s the fluctuation that matters. The amount of turbulence at the top of a blade versus at the bottom of the rotation leads to vibration and that leads to fatigue. Blades are longer and flex more on larger turbines so their designers also worry about them bending to the point where they could hit the tower. If that happens, the turbine would be shut down to prevent damage. In addition, blades that pass near the tower momentarily pass through slower moving air for a change in loading. That once-per-revolution condition adds to the vibration. So a good vibration analysis ultimately leads to a fatigue-of-composites study and that needs good CFD and wind data.
“If you do a good job on wind-farm analysis and know where the wakes will form and dissipate due to terrain variations, that would be better information to guide turbine placement than to, say, spacing them equally,” adds Nagy.

Here’s another problem with wind-farm predictions and it’s a big one: Almost all farms end up generating at least 10% less power than the values predicted during the planning and financing stage. Understandably, that disappoints owners.
It turns out that prospects often want OEMs to predict that if they sell this many turbines for a particular placement, the turbines will produce this much power. “The wind data is available from all year round for strength, turbulence, and directions. After evaluating all this stuff, OEMs come up with an estimate for how much the farm can yield, assuming downtime for maintenance. And then they guarantee some level of power output. Apparently, if the farms don’t meet the predicted output, the turbine builder pays penalties,” says Nagy. So OEMs guarantee an output. And should a competitor forecast a higher figure, the second OEM might get the job. So an accurate prediction is essential. To assist, Nagy says his company developed what it calls an actuated disc as a way to more economically model a turbine’s wake effects.

Using the company’s CFD software, wind-farm designers would place a stick to represent a tower and mount a disc on it with thickness and diameter to represent the turbine rotating blade set. “Wind hits the disc’s front side, extracts energy, and modified wind flows out the backside. Each model then predicts swirl and turbulence based on previous detailed studies adjusted or calibrated for wind speed. It’s one way to simplify the analysis,” says Nagy. “Although still compute intensive, we’ve done runs with over a dozen turbines on a landscape to examine wake formations.”
CFD4An additional challenge for turbine OEMs, says Nagy, has been to integrate CFD software into the work flow of their field-siting tasks. “For example, a prospect wants to build a wind farm on a particular parcel. One European OEM would then examine the wind and weather data for the topology and suggest placing turbines in precise locations. The field engineer, in the past, would take this data and feed it into proprietary in-house software that would make an assessment of each proposed turbine and decide whether it would be a normal or “complex” situation. If the wind is turbulent enough, or if the terrain is rugged enough to produce local wind effects, such as from a canyon or ridge, the in-house software would require a more detailed CFD study for the turbine. Then the field engineer would send wind and topology files to company headquarters and a group there will do the CFD and generate reports and return them to the field engineer. That would take about three weeks, not because it ran for three weeks, but more likely because it took some human intervention, for example, to transfer files among multiple modules (meshing, boundary conditions, solving), adjust the mesh, and monitor the run. After about three weeks, the field engineer had something to present to the client.

Nagy says his company was able to help significantly streamline the process for the OEM. “Now that complex, three-week task is fully automated and reduced to two hours. It’s literally push button. The user supplies the needed files and the STAR- CCM+ software does the rest.” Nagy acknowledges that significant credit for the short run time goes to the OEM running this process on a HPC cluster of some 1,200 cores.
Another task wind farm operators are looking at is forecasted winds. If a lull is forecasted, the owner might schedule some preventative maintenance. But if good wind is in the offing, he might plan on producing power.

::Windpower Engineering::

Discuss these considerations for designing turbine hydraulics at www.EngineeringExchange.com

ex_bug

Report says Wind Market to Bounce Back in 2010

September 18, 2009 by WindPower Engineering  
Filed under Wind Watch

windwatchbounceback
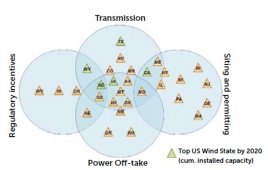
Despite the near-term market uncertainty created by the financial crisis, the longer-term prospects for the US wind industry remain strong. While the rapidly growing U.S. market – expanding at an average annual rate of 40% — has slowed to pre-2008 levels, a recent market study from Emerging Energy Research, Cambridge, Mass. (emerging-energy.com) expects the market to bounceback starting in 2010.
While the next year or two may prove difficult to weather for U.S. wind companies across the value chain, the study says accelerating federal policy momentum and a growing focus on renewable-energy and its transmission lines are setting a stage for tremendous long-term growth potential once liquidity returns to the financial sector.
EER’s study, U.S. Wind Power Markets and Strategies, 2009-2020, provides 270 pages of analysis of the U.S. wind industry with market forecasts to 2020, market trend analysis, and strategies of key players competing for U.S. wind including utilities, developers, IPPs, wind turbine OEMs, and component manufacturers. Key trends addressed in the study include:
•    New stimulus financing options create near-term uncertainty, but long-term potential
•    Federal policy accelerating toward a national RPS
•    Developers position to weather near-term challenges for long-term growth
•    Inter-state transmission build-out remains crucial to long-term growth
•    US wind growth likely before exploding over the long term
An executive summary is available at http://tinyurl.com/eerrep

Cylindrical Towers are the Secret to Capturing More Wind

The first prototype of a wind-focusing cylinder, built on a campus roof top, speeds wind flow through the turbines. The truss and arms that hold the turbines, pivot to keep the rotors in the fastest wind. Total output would be about 8 kW. A second prototype will be smaller with about the same output.

The first prototype of a wind-focusing cylinder, built on a campus roof top, speeds wind flow through the turbines. The truss and arms that hold the turbines, pivot to keep the rotors in the fastest wind. Total output would be about 8 kW. A second prototype will be smaller with about the same output.

A classical image of fluid flowing around a cylinder shows it speeding up at the sides and slowing or stagnating at the front and back. This let Majid Rashidi, Professor of Mechanical Engineering at Cleveland State University, realize that placing wind turbines in the naturally forming high-speed areas at the sides would let them generate more power than if the turbines were free standing. To test his hypothesis, Rashidi applied for a two-year grant from the Dept. of Energy and NREL, won it, and built a 25-ft diameter cylindrical tower on the roof of a CSU building. His idea mounts a pivoted truss across the top of a cylindrical tower to extend beyond its circumference. Arms extend down from the end of the truss to hold four 2-m diameter turbines (two on each side). The turbines are the off-the-shelf Swift design from Cascade Renewable Energy Solutions, Grand Rapids, Mich. Each is rated for about 2 kW at max wind speed.

Controls and monitors nearby show what each turbine is producing. During my visit, an almost calm morning, the control turbine some 150 ft away was barely turning in the light breeze while those by Rashidi’s cylinder were spinning much faster. And when the wind picked up, the turbines made no discernable noise, partially because the circular rim prevents vortex shedding at the blade tip, a noise source. The existing design uses a time averaged control to turn the device into the wind. But Rachidi plans on testing a passive less expensive directional fin, like a weather vane, for the same function.

The CSU professor says his design improves power capture by three to four fold. In addition, the design would be ideal for retrofitting existing round structures such as silos or water towers that adorn many rooftops in large cities. Rashidi says the school owns the technology and is still in the proof of concept stage. Commercialization would be a next step.

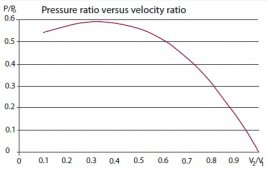
The Physics and Economics of Wind Turbines

September 17, 2009 by WindPower Engineering  
Filed under Energy Policy, Wind Power News

A big issue in generating power from any renewable energy source is the cost of generation versus that for conventional hydrocarbon fuel sources. Wind energy is estimated to have the lowest cost of all renewable options. Governments and private businesses have been investing in research in this technology and results are paying off. For example, it is estimated that the cost per kilowatt-hour (cents/kWh) from wind energy has been reduced by 80% over the last two decades. Recent high efficiency wind turbines develop electricity for about 11 to 13 cents/kWh depending on turbine design and location. However, the lowest cost of hydrocarbon fuel sources is coal, generating electricity for about 6 cents/kWh. Still, there are many opportunities to further reduce the cost of wind energy.

The basics
A few basic calculations provide good insight to the issues of wind turbine design. Wind is an air mass moving from a high-pressure area to one of low pressure. To calculate the energy in wind, consider a segment of air shaped like a horizontal cylinder. The energy in it depends on the volume of air, density, and wind speed. The mass per unit time for a slice of the cylinder is:

M = ρAV
where
M = mass
ρ= density
A = area
V = wind speed

The function of a wind turbine is to transform the wind’s kinetic energy into electricity. Therefore, we must start with a calculation of kinetic energy or Ek, where:

Ek = ½ MV2

Substituting the mass of the air cylinder (ρAV = M) gives

Ek = ½ ρAV3

Thus, the amount of energy in the wind depends on the density of the air, area (in this case, the area swept by the wind-turbine rotor) and the cube of the wind velocity. The equation underscores the point that selecting an area of strong winds is advantageous because the power in the wind increases with the cube of its speed.
The equation looks impressive, but wind turbines are not 100% efficient. If a turbine was completely efficient it would transform all kinetic energy from the wind into electricity. This would mean the wind velocity would drop to zero behind the blade. We know that is not the case. In fact, Albert Betz published a book in 1926 that showed it is only possible to extract 16/27 or 59% of the energy from a wind turbine. This is Betz’ law. Therefore the theoretical energy model for a wind turbine is:

Ek max = 16/27 (½ρAV3)

In practice, however, the amount of extractable energy ranges from only 40 to 47%.

Reducing costs

A brief recap is that we can extract less than half the energy from the wind and that depends on air density and wind speed. So the next question is: How can we further reduce the cost of producing electricity from the wind? Three main considerations are site selection, swept surface or rotor diameter, and reducing a turbine’s cost for capital, installation, and maintenance.

Site selection

It is obvious from the wind-power equation that it is best to place wind turbines in areas of strong sustainable winds. Low wind speeds have no significant extractable energy when compared to areas of even moderate wind speeds.
Site selection requires extensive study of an area’s topology, and annual wind speeds and directions. Wind analysts study meteorological trends and generate tools such as a wind rose that show annual distributions of wind speeds and their direction frequencies. Wind-farm investors are then presented with cost justifications based on farm locations. Turbine engineers can select a best design based on the type of winds at the location. One trend is to place wind turbines offshore to take advantage of the unobstructed winds over water.

Swept surface

The amount of energy extracted from the wind is directly propositional to the swept surface area. Large wind turbines leverage economies of scale with an increased blade diameter. The industry has seen a continual increase in diameters from 40 meters (131 ft) and 20 to 60-kW outputs in the 1970s to modern 90 m (295 ft) 3-MW designs. The largest wind turbine today is a 7+ MW 126 m (413 ft) three bladed design engineered by German based Enercon for a research and development project.  Wind-energy-the-facts.org estimates that with improved manufacture methods we could see 250-m (820 ft) rotors on 20 MW machines by 2020.

Swept surfaces usually leads to confusion regarding a best wind-turbine design. An important factor in rotor design is the tip-speed ratio (Rts). This refers to the ratio between the wind speed and the blade-tip speed:
Rts = Vblade tip /Vwind
where
Vblade tip = speed of the blade tip

Feature 1 GraphWhy is this important? Imagine a wind turbine spinning slowly, say 1 rpm. Most of the wind (and energy) would pass through the space between the blades, thus “wasting” the energy and reducing the efficiency of the turbine.

On the other hand if the turbine spins “too” fast, two problems arise. The first is that the fast spinning blades acts like a wall to the wind. This reduces wind velocity in front of the blade much as the wind slows in front of a large building. This is a negative condition because the power of the wind is proportional to the cube of the wind speed. The second problem is that each blade of the turbine creates some turbulence in the air. When the blades spin too fast, each “slices” into the turbulence of the proceeding blade, again reducing the turbine efficiency.

A best tip-speed ratio depends on the number of blades in the rotor. The fewer blades, the faster the wind turbine spins to extract maximum power from the wind. Early experiments showed that a two-blade rotor has an optimum tip-speed ratio of about 6, a three-blade design about 5, and four blades, about 3. However, more recent highly efficient aerofoil designs have increased the numbers by 25 to 30%, which allows increasing rpm and therefore generating more power.

Reducing capital and maintenance costs
Manufacturers of wind turbines have been improving designs to reduce the system cost. Wind turbines are complex machines and so have many areas where costs can trimmed without a loss in performance.   Berkeley National Labs data base has shown that the costs of wind turbine had been declining but have recently seen some increases in costs of the past few years.

Source: NREL

Source: NREL

One consideration leverages the advantages of a two-blade turbine. The obvious is the reduced cost of one blade. As the trend of larger rotor diameters continues, material use and blade cost will also increase. Other advantages of a two-blade design include savings on smaller mechanical equipment due to the lower torque of faster rotor speeds. A lower turbine weight then allows reducing the size or eliminating yaw controls. Lower installation costs come from only one top-lift. And less equipment means lower maintenance costs. Also as more turbines are installed offshore, two bladed designs offer the advantage of less weight which can directly reduce the cost of the tower platforms.

But a cost comparison between three and two-blade designs is not as simple as eliminating the cost of one blade. The three-blade turbine is a proven design and its rotor solves some mechanical loading challenges. Two-blade designs need additional equipment in the rotor hub to compensate for the loading, and thus, may increase the cost of the rotor compared with a three-blade hub. However, a total cost savings from a two blade design would have to include all of the savings described above.

With all the benefits of a two blade design, why are three blade designs in such wide use? And what mechanical loading challenges do three-blade designs solve? Gyroscopic tendencies are one issue.

Spinning rotors act like gyroscopes in their plane of rotation. That is, they are content to rotate in a plane but offer great resistance when changing directions (yawing) out of that plane. This is problematic when wind direction changes and the wind turbine yaws into the wind to maximize power generation and equalize blade loads.

Two and three-blade rotors both generate gyroscopic forces. However, the advantage of a three blade design is that at least two of the blades are always out the vertical plane at one time, thus reducing shaft and gearbox stresses when the turbine yaws.
When the wind changes direction and the blades of a two-bladed design are in the vertical, 6 o’clock position, there is a minimal amount of force on the hub because the loading of the blades are relatively equal.  However when the blades begin to move to the horizontal position it generates unequal loading that adds stress to the hub and gearbox.

To solve the problems, most modern two-blade designs use a hub that is not rigidly fixed to the turbine shaft, so it “teeters” a few degrees to reduce stresses. As manufacturers build larger and heavier wind turbines, gyroscopic forces will increase requiring larger and stronger two and three-blade hubs and thus increasing costs.

There is, however, an idea that with proper research and investment could eliminate the large gyroscopic forces on two-blade windmills, thereby making them viable for 5 to 20MW machines. The idea is cyclical feathering.

It can be used for keeping a wind turbine facing into the wind without hub and gearbox stresses. The idea is to control pitch of individual blades, thereby decreasing gyroscopic forces on the rotor when yawing. This would take advantage of the wind’s kinetic energy on the blade to assist in turning the turbine into the wind. Such a control feature cyclically alters blade pitch as the wind direction changes so as to present different angles of attack between the blades and wind. Another plus for the design: it eliminates the need for yaw drive motors.

Experiments with cyclical feathering on wind turbines have been conducted on a small scale and show great potential. A similar control used on helicopter tail rotors has been reliable and effective. Continued research and investments are needed before this technology reaches large-scale wind turbines.

Discuss the physics and economics of wind turbines at www.EngineeringExchange.com
ex_bug

Considerations for Designing Turbine Hydraulics

An efficient, responsive, and reliable blade-pitch control on a wind turbine is made from many valves, pumps, hoses, reservoirs, and brakes. They must all work together to meet the demanding requirements placed on the pitch control in a turbine hub.
An effective hydraulic blade-pitch control (BPC) requires knowing the performance characteristics of each component and their likely interactions with other components. The task also calls for many tests that go beyond those applied to less demanding applications. In addition, the design work requires experience with the peculiarities of wind turbines’ operating environment.
For instance
Valve selection provides a good example of the complexity of the designer’s task. Selecting the right hydraulic proportional valves for BPC systems is a critical step.
From a functional viewpoint, valves in a BPC system are not required to do anything particularly difficult or unusual. They simply control the flow of fluid to cylinders in response to sensor signals in a fairly straightforward closed-loop servo control circuit.
What is unusual is that the valves are housed in a nacelle on a several-hundred-foot tower. What’s more, the tower is likely in an inhospitable environment, such as offshore or on a mountaintop.

More than 35,000 turbines globally now use Vickers KB proportional valves in their BPC systems. Testing confirms the proportional valves can continuously operate in the harsh environment without failure. Fitting the valves with the company’s screw-in cartridge valves on individual blade control blocks place them among the most reliable

Testing confirms the proportional valves can continuously operate in the harsh environment without failure.

The valves are subject to temperature extremes, high and variable rotational and vibration loads, and long periods between maintenance. Servicing such valves requires the attention of highly specialized personnel who can climb and don’t mind working at heights while lugging up equally specialized safety equipment in addition to their normal tools.
These factors combine to increase the premium placed on BPC valve reliability. Standard testing protocols will not sufficiently stress a valve to prove its ability to perform under the extreme conditions.
In standard life testing, the operating parameters of an application are known and the test sample is subjected to a test within them. Simple product survival is considered a success.
Based on its experience, my company has adopted a more rigorous protocol called Highly Accelerated Life Testing (HALT) to help engineers better understand the performance of hydraulic valves operating under the harsh conditions found in wind-turbine nacelles. HALT uses parameters well outside those encountered in the typical service life of the application and then tests products to failure. HALT results let a team of hydraulic designers focus on making, for example, a valve more reliable in the areas where a failure is most likely. More important, HALT gives the company an objective, documented, and repeatable way to qualify its KB proportional valves, the series the company recommends for wind turbines.
In response to the wind industry’s need for more precise control, KB Series proportional valves are also being equipped with an improved control interface featuring CANbus communication using the CANopen protocol. These integrated electronic controls are packaged to industry IP67 environmental standards to meet the needs of the next generation of wind turbines.

Beyond the valve

The Match Mate series of hydraulic hoses from Eaton are color coded to avoid installation mixups.

The Match Mate series of hydraulic hoses from Eaton are color coded to avoid installation mixups.

A lot can go wrong in a nacelle. A valve may function well but a broken hose or leaking fitting could let hydraulic fluid onto the floor. Or, if the electronic controls have insufficient bandwidth to handle the signal load, the best outcome to hope for is an automatic shutdown that takes the turbine out of service.
The latest generation of CANbus compatible valve controllers operating under the CANopen protocol have the bandwidth to accommodate almost any practical load of control signals plus inputs from sensors that monitor valve and actuator performance. By identifying small degradations in performance, sensors and software in today’s systems can proactively schedule preventive maintenance and even component replacement during scheduled downtime.
Hoses and fittings are probably not high on most lists of what some designers call critical components, but they should be. In addition to their role in hydraulic circuits, hoses and fittings are key components in gearbox lubrication, typically an active system with constantly circulating fluids.
Hoses with class-zero leakage do not weep in extreme temperature variations or on cool down, so selecting them eliminates a potential source of fluid loss. Such hoses also promote a safer working environment inside the nacelle by keeping its floor drier and delivering extended service lives.
Premium hoses made with Teflon PTFE are resistant to bulging under pressure, making them a first choice for critical braking circuits. They are also chemically inert which is important in gearbox lubrication circuits.
Color coded fittings, such as those on Match Mate series from Eaton, can help prevent assembly errors on a shop floor, and potentially catastrophic failures that might result when the system is put into service.
Even parts as simple as a reservoir is a potential point of failure requiring features to function well in a wind turbine. Most hydraulic power units are not simultaneously subjected to vibration and rotation. But the combination is common in wind turbines.
Ordinary tank designs will not keep hydraulic fluid from escaping through reservoir breathers and covers because they are not designed to withstand pressure at their tops. Most wind turbine OEMs now require that tanks withstand at least the equivalent pressure of 12-in. column of fluid above the tank top without leaks.
Not every component in a wind turbine BPC system must be specially engineered. Most pumps used, such as the Vickers PVM piston series, are often selected without modifications. Hydraulic component manufacturers have been building similar pumps for use on off-highway equipment and in nuclear power plants for more than 40 years.

Clutches and brakes are additional components often omitted from critical lists. Wind turbines could not function without yaw brakes that hold nacelles into the wind. Drive-shaft brakes lock rotating equipment to avoid damage under extreme conditions and provide a safe environment for maintenance. Clutches connect the blades to the gearbox and generator.

Increasing system complexity
As system complexity increases, how components interact plays a great a role in system reliability. In systems as complex as today’s BPCs, properly matching operational characteristics of individual components can have a tremendous impact on overall system efficiency, performance, and reliability.
This idea suggests a single-supplier design philosophy as opposed to a mix and match approach. Regardless of which manufacturer’s products are chosen, experience shows that the system is more likely to be successful if all of the major component parts come from that manufacturer.
The single-supplier approach can also impact ongoing reliability and operating costs of a system if the supplier maintains a parts and service footprint matches the global distribution of wind turbine installations. This is an important issue when one considers the geographic locations in which wind turbines are likely to be installed. They can be almost anywhere on the planet.
If spare parts and service are not locally available, a turbine needing a replacement valve, pump, hose, clutch, or anything else is likely to be out of service for an extended period until the parts arrive. On the other hand, if the component manufacturer has a global distribution system, parts and services are more likely to be locally available when needed.
Factory-level repair and remanufacturing are also important concerns given the relatively high cost of the more specialized components used in wind turbine BPC systems. Such OEM repaired valves also carry original factory warranties, something non-OEM facilities cannot provide
Experience shows that minimizing the number of individual manufacturers involved in each step of the process, and taking a big picture approach is one of the best ways to maximize the probability of a successful hydraulic wind turbine outcome.

Discuss these considerations for designing turbine hydraulics at www.EngineeringExchange.com
ex_bug

::Windpower Engineering::

Contributor

Ian Keyworth
Manager
Global Sales & Market Development
Eaton Corp.
Eden Prairie, Minn.

No Shortage of Amusing Wind Turbine Ideas

Arizona State architectural student, identified only as Joe, says his idea is to retrofit horizontal steel structures that currently hold freeway signs with two horizontal-axis wind turbines powered by the turbulence from passing cars. (Joe admits borrowing the turbine design from U.K. based quietrevolution). He figures (without showing figures) that with an average vehicle speed of about 70 mph and an average wind speed of 10 mph, each turbine could annually produce 9,600kWh.

Freeway turbine

Inventor and consultant Larry Dobson has built a working model of his vertical axis involute spiral drag propulsion wind turbine. He posts a video of it at http://tinyurl.com/larrydobson. He says he has experimented with several designs to find a best one. Dobson says the vertical axis wind turbine is a drag propulsion device with strong lift components that let the rim exceed wind speed, which continually diverts wind mass to work on the sail.  Results from two tests indicate he can increase the low-speed power significantly over a horizontal axis wind turbine, largely because it uses drag from large surface-area vanes instead of just lift propulsion from a thin airfoil-shaped blade.

Larry

The Wind Tunnel Footbridge is part modern sculpture, part green technology, and part weird admits Designer Michael Jantzen. He surrounds the bridge with five bladed wheels that spin… like windmills. Each wheel spins in an opposite direction and at varying speeds to make best use of wind direction. Best of all, he says, this entertaining concept bridge could harness the wind that propels it to produce and store energy. Jantzen suggests constructing these at public attractions such as museums and parks, but would like to see them replace skywalks over highways.

footbridge

::Windpower Engineering::

How to Get Turbine Gears and Bearings to (Almost) Talk

A gear manufacturer recently confided that a turbine OEM was asking for quotes to repair yaw gears that were failing after just five years in service. Although the mystery of the early failure has not yet been resolved, the tale says that despite centuries of experience with gear designs and materials, turbines have a lot to say. One way to keep an ear on the rotating machinery high in a nacelle is by monitoring vibration at critical locations. This is done by fixing accelerometers to gearbox casings. Readouts from such sensors are in the time domain so their graphs show acceleration (in G’s) versus time. But a fast Fourier transform (FFT) performed by software can translate it into the frequency domain to show what defect frequencies are occurring. That information tells what’s going on inside a gearbox.

“These innovations are not yet good enough to pinpointing an exact failure date because of variability and loading,” says Bill Stan, president of Horsburgh and Scott NDT, Cleveland, Ohio. (horsburghandscott.com). Still, says the condition monitoring expert, the data collected from an accelerometer and FFT can point to the four classic phases of antifriction-bearing failure that tell the severity of a bearing defect or the condition of the gear teeth which again provides severity of gear problems. For example in regard to bearing defects, says Stan:

•    Phase one defects typically have elevated vibration in the high frequency range
•    Phase two defects are illustrated by elevated vibration at the natural frequencies of the bearing components
•    Phase three shows a dominant bearing defect peaks at the defect frequencies and their harmonics, and possibly impacting might be visible on the vibration waveform.
•    Phase four, the whole vibration floor of the FFT rises. The defect coefficient actually disappears because the magnitude of the broad band vibration envelops them.

Vibration trend graphs can be generated using peaks or sum of vibration energy either across the spectrum or an individual band.

Vibration trend graphs can be generated using peaks or sum of vibration energy either across the spectrum or an individual band.

“So by understanding what phase the gear or bearing is in and looking at a trend screen, maintenance people will get a valuable understanding of how long a component will last and more importantly, whether or not corrective action can be taken to minimize the mechanical stressing. Maintenance managers can then see which of the turbines has the highest and most critical vibration thus establishing which units need maintenance first.

Of the two characteristics monitored most often – vibration and temperature –vibration provides much better insight into the condition of a particular component and much earlier defect detection. Collecting vibration data allows its transformation into a spectrum using FFT.  The next step is to take the defect coefficients provided by all bearing manufactures and multiply these by the shaft speed. This calculation provides discrete frequencies on the spectrum that can be monitored by the vibration monitoring software. The same holds true for gear frequencies which are the product of the number of gear teeth times shaft speed.

State-of-the-art condition monitoring systems use software that can narrow band the spectrum or cut the spectrum into multiple bands each of which contains defect frequencies. These bands have individual alarms and reports. With these, high-vibration alarms provide more that just an overall alarm. They can pinpoint a root cause for an alarm and its severity.
A spectrum analysis lets a sensor mounted to a bearing, collect and monitor gear-mesh frequencies and shaft misalignment in addition to bearing conditions because all vibrations are present on the gearbox surface where the sensor is mounted.

In this example data, each band, a frequency of interest,  has a different high and low level alarm threshold depending on tolerences established during testing.

In this example data, each band, a frequency of interest, has a different high and low level alarm threshold depending on tolerences established during testing.

At one time, high equipment costs gave owners pause over adding options to their equipment. “That attitude could change with the drop in hardware costs. Conversations with operators and vendors tell me there is a definite disparity between state-of-the-art condition monitoring equipment and what is in use. I think part of that disparity is based on initial cost estimates owners got for installing equipment from some vendors, so high it was shocking. Today, monitoring equipment is PC based and works with the XP operating system, and reliable software provides an efficient operating platform that gives a software engineer more flexibility in designing a stable and reliable program suitable for condition monitoring.

Stan says refitting a gearbox with condition monitoring sensors is not difficult because the accelerometers attach to the outside near the bearing or gear of interest. Sensors mount magnetically or with adhesives. There is no drilling as was necessary for proximity probes used in other industries to monitor eddy currents. They still have their place in vibration monitoring, primarily for journal bearings on ground-based equipment. In the past, vibration sensors were relatively expensive. But the use of ceramic crystals in piezoelectric accelerometers has significantly brought their cost down. It is important to note that a successful application depends on selecting the right sensor, and wiring that minimizes noise.

Even in that late 90s, people were still quoting $30,000 Dec Alpha boxes to crunch the numbers. “It was the only thing with sufficient computational speed, and guys like me wanted to bring data from every accelerometer into a computer to do an FFT conversion to see the frequency domain,” says Stan. The net result is that as the computational speed of computers has increased along with storage, their price has come way down making it possible to combine low-cost sensors and computers with reliable software in monitoring equipment that was just not available until recently.

Wind farms will not be able to sustain many unplanned shutdowns if they are to be considered economic alternatives to other energy producers. They will have to be more durable. Condition monitoring can help make wind turbines more reliable and cost effective in the same way they have been used in chemical plants, steel mills, and mining because the physics behind vibration base condition monitoring transcends all industries and manufacturing.

::Windpower Engineering::

Wind Power Feedback Form
Feedback Analytics