Liz Walls / CEO / Cancalia Engineering & Consulting

Liz Walls
When planning the development of a wind farm, one of the first and most vital steps creates a wind-flow model that describes how the wind resource varies across the project area. The wind-flow model helps guide the turbine layout and will ultimately determine whether or not the wind-farm project is a viable investment.
Over the last couple decades, the models most commonly used included linear models, such as WAsP, and more complex CFD models (Computational Fluid Dynamics). The upside to linear models is that they are simple to set up, quick to generate estimates, and relatively inexpensive. The drawback to this modeling approach, however, is its inability to accurately model the wind speed in anything but simple terrain. On the other end of the spectrum, CFD models can generate accurate wind flow estimates, but these types of models can be difficult to properly initialize. Their computation time can take hours or days, and the software is expensive.
Thinking differently about modeling
The Continuum wind-flow model (patent pending) was created to take the best of these traditionally used models and provide the wind industry with a tool that is quick and easy to use, affordably priced, and delivers reliably accurate wind speed and energy estimates. The science behind Continuum stems from a simplified analysis of the Navier-Stokes equation, which describes the motion of viscous substances and is the same basic equation used in CFD models. This model incorporates all of the met-site data by cross predicting between each pair and then, using a self-learning algorithm, tuning the model until the met cross-prediction error is minimized.
This model has evolved over the last decade and has been validated at dozens of project sites. Also, in a side-by-side comparison with two other wind-flow models, Continuum produced a model error that was about half of the other two. [Round Robin RMS error: Continuum (1.55%), OpenWind (2.93%), and WAsP (3.34%)].
An overview
When Continuum is first opened, the user is presented with the Input tab to import topography and land-cover data. The topography data can be uploaded as either a GeoTIFF or .XYZ file. Accepted formats for the land cover data include GeoTIFF and .MAP files. Also on this tab, the user imports the wind speed and wind direction distributions measured at the met sites in the form of TAB files, a standard file format in wind software programs.
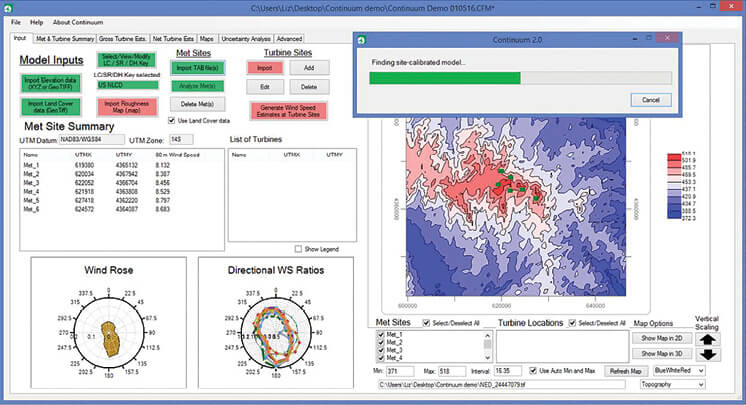
Continuum users are first presented with the input screen. Topography data can be uploaded in either GeoTIFF or .XYZ formats.
Once the required inputs have been successfully loaded, Continuum automatically begins the model creation. It also guides the user in the model set-up by color-coding various tasks in which green buttons represent a completed task and red indicates an incomplete task. The computation time of the wind-flow model creation varies depending on the computer speed, number of met masts, and terrain complexity. On a standard laptop, the model typically completes in 5 to 15 minutes.
Lastly on the Input tab, the user can import the turbine layout as a .CSV file and then simply click the button labeled “Generate Wind Speed Estimates at Turbine Sites” to start the calculations.
Gross turbine estimates
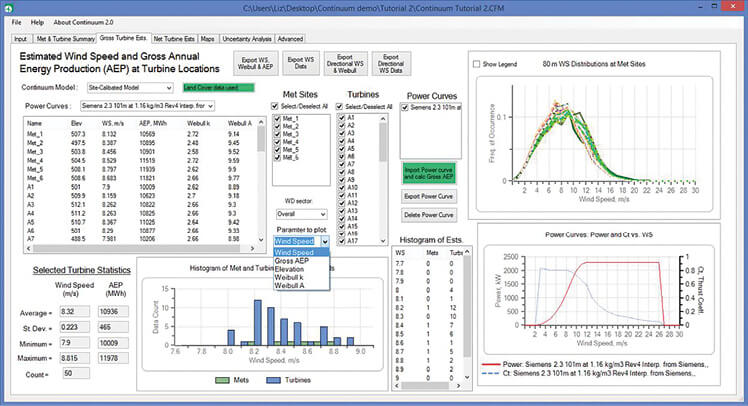
Users import power curves and other information to the Gross Turbine Ests screen
On the ‘Gross Turbine Ests.’ tab, the user can import turbine power and thrust curves for an unlimited number of models. As soon as a power curve has been uploaded, the software generates the gross annual energy production (AEP) at each turbine site. On this tab, users can view and export the turbine wind speeds, Weibull parameters, AEP, and wind speed distributions overall and by wind direction sector. All export files are formatted .CSV files for easy import into other programs.
Net turbine estimates and maps
Once the gross energy estimates have been formed at the turbine sites, the wake losses and net AEP can be estimated on the ‘Net Turbine Ests.’ tab. Here, users can select between the Eddy Viscosity or Deep-Array Eddy Viscosity wake models. Also on this tab, maps of the waked wind speed can be generated as shown in the screenshot above. This is a great way to visualize the generated wakes and help guide turbine placement. A summary report including the net energy estimates and a summary of losses can be easily exported.
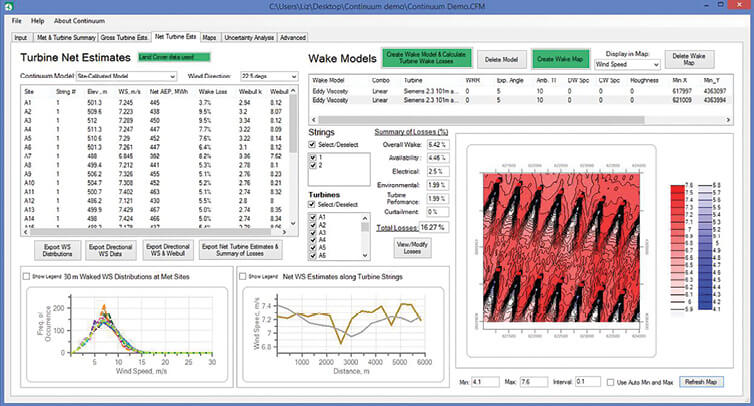
Final stage of the wind flow analysis comes at the Net turbine estimates screen. Wake models can guide turbine placements.
On the Maps tab, users can generate wind speed and energy maps of the project area. These maps may be exported as a .CSV and the wind speed maps can also be saved to a .WRG file, which can then be imported into other wind energy software programs.
Uncertainty analysis
The uncertainty of the wind-flow model plays a large role in the project’s overall P99, so it is important to have confidence in the uncertainty value used in the evaluation. Often wind-resource analysts will use an educated guess for the wind-flow model uncertainty. To remove such guesswork, the Continuum user can easily and quickly perform a ‘Round Robin’ or ‘Leave One Out’ analysis to form an objective estimate of the wind-flow model uncertainty. The Uncertainty tab also provides estimates of the wind speed and energy uncertainties generated at the turbine sites.
Bracing for busy times
The wind industry is growing across the globe at an increasingly fast rate and wind-farm developers, turbine manufacturers, and consultants are doing all that they can to keep up with demand. It is therefore more important than ever to ensure the wind resource assessment team is equipped with the right tools to quickly generate accurate estimates so that the most informed decisions can be made in a timely manner.
Continuum offers an innovative approach to wind-flow modeling, which has proven accurate and provides users with an objective way to determine the model uncertainty. The simplified approach circumvents the complexity of CFD, allowing for a much faster computation time without sacrificing model accuracy. The intuitive and user-friendly interface also helps expedite and streamline wind-flow modeling so that estimates are generated quickly and with confidence.
The software’s website, www.cancalia.com, includes a peer-reviewed paper with the Continuum model theory and validation studies. Interested parties can request a free trial of the software. Continuum users are first presented with the input screen. Topography data can be uploaded in either GeoTIFF or .XYZ formats. 
Filed Under: News, Software


