By John W. Guariglia
RLA Associate Principal | Saratoga Associates
The potential effect utility-scale wind energy projects have on the aesthetic quality of regional landscapes is a common concern for regulators and stakeholders. Failure to address this concern early in the public review process can lead to misinterpretation, diminished public confidence, and delays in project permitting.
In areas that have a rich wind resource, it’s not uncommon for different developers to propose two or more projects within a single viewshed. With little to distinguish one project from another, there’s the potential for dozens or even hundreds of turbines across one landscape.
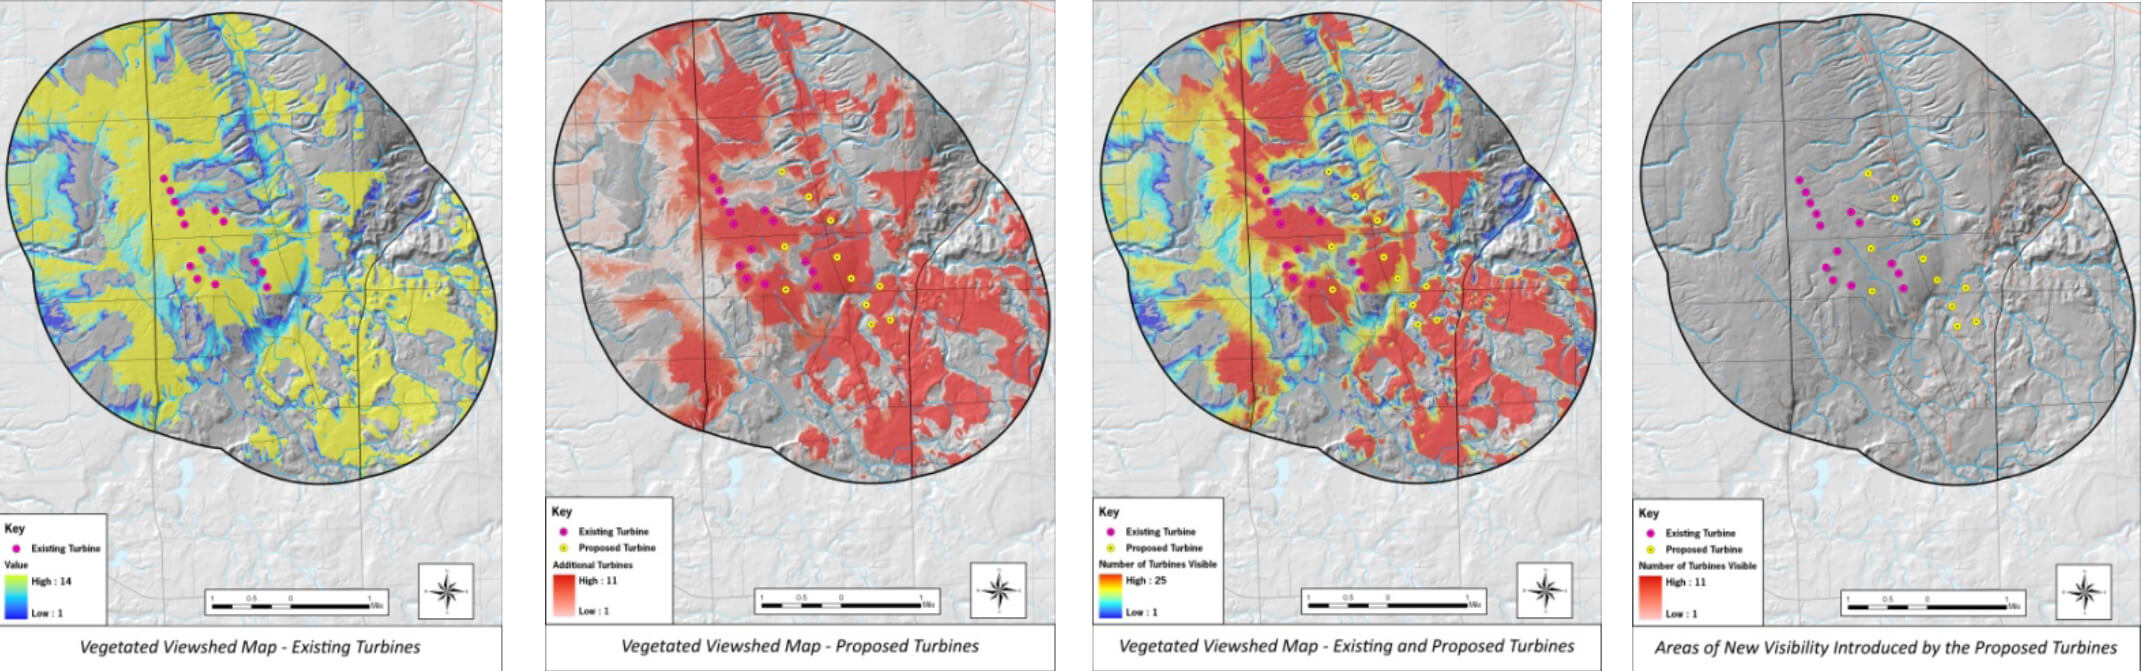
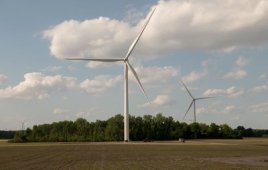
The viewshed maps here were created to illustrate the visibility of a proposed 11-turbine project located immediately adjacent to an existing 14 turbine wind farm. The study area of each map extends to an outside radius of two-miles from both projects, and includes the screening effect of topography and existing forest vegetation. The maps were calculated for blade tip height of each existing and proposed turbine. GIS analysis was also used to determine the degree of heightened impact and the areas of new impact.
Although one of a developer’s primary responsibilities is to identify and mitigate the potential visual impact associated with its specific project application, this role is becoming increasingly complicated. Regulators are now often requiring consideration of the cumulative visual impact of adjacent existing or proposed projects on the scenic resources of a host community.
However, most regulatory agencies don’t have specific rules, regulations, or standards for completing a cumulative visual assessment, nor do they offer meaningful guidance concerning appropriate assessment methods. Therefore, the developer must find a way to determine the best way to evaluate the projects.
Making the assessments
An assessment of potential visual impacts takes advantage of the inventory and analysis efforts completed for the proposed project subject to the investigation. A cumulative visual impact assessment, which is typically prepared by a licensed landscape architect, is completed to provide a direct comparison of the existing visual condition with or without a wind project, to the first proposed project, the second project, and so forth.
By using viewshed mapping (also known as zone of visibility mapping) and photo-simulation data sets developed for the primary project, it’s simple to add a second or third project for cumulative assessment and at low cost to the developer.
In addition to written documentation discussing the potential cumulative impact, two tools – viewshed mapping and photographic simulation – are typically used by visual analysts assessing visibility and potential impact.

From here, your wind farm will look like this.
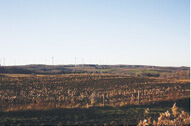
The photo simulations portray a proposed project view.
1. Viewshed mapping is a GIS-based tool that identifies the geographic area within which there’s a relatively high probability that some portion of the project(s) are visible. The maps identify areas where further investigation is appropriate, and determine sensitive viewing areas and locations of affected viewer groups.
The two types of maps commonly used in identifying visibility are:
- Topography only viewshed maps account for the screening effect of existing topography (e.g., bare earth conditions). This worst-case treeless condition analysis is used to eliminate unaffected areas from further consideration.
- Vegetated viewshed maps incorporate existing forest vegetation into the topographic analysis to identify areas of probable screening based on existing mature forest cover. This mapping type acceptably identifies the geographic area within which one would expect to be substantially screened by intervening forest vegetation. Vegetated viewshed maps provide a more realistic representation of project visibility than the bare earth assessment and enables focused inventory of impacted resources.
Data from the cumulative viewshed maps is generally used to illustrate areas impacted by one project, compared to areas impacted by multiple projects (referred to as “new visibility”). This information can help determine the net increase in the number of turbines visible from any given place (referred to as “heightened visibility”). However, these maps don’t help illustrate the amount of each turbine that’s visible, the effect that distance and atmospheric conditions have on potential project visibility, or the aesthetic character of what is visible.
2. Photographic simulations are an effective and highly used tool to illustrate the degree and character of project visibility of the wind energy project(s) from a specific location. Simulations are developed by super-imposing a rendering of a three-dimensional computer model of a project into a high-resolution existing conditions photograph.
Simulations, although they represent the view from a specific vantage point, are used to illustrate what the project will look like within the landscape (“visual character”). They also disclose how much of each turbine is visible above intervening landform and vegetation (“degree of visibility”). Simulations provide clear interpretation of the effect of atmospheric and linear perspective.
Although viewshed mapping and photographic simulation provide usable information about the potential cumulative impact of multiple projects, they offer one method of analysis. Alone they do not adequately communicate the new and heightened impact associated with adjacent wind energy projects.
Ideally, mapping and simulation must take place in tandem, along with proper documentation (e.g., cumulative visual impact assessment report) to fully convey cumulative project visibility. 
For a digital copy of the entire October issue of Windpower Engineering & Development, click here.
Filed Under: Uncategorized