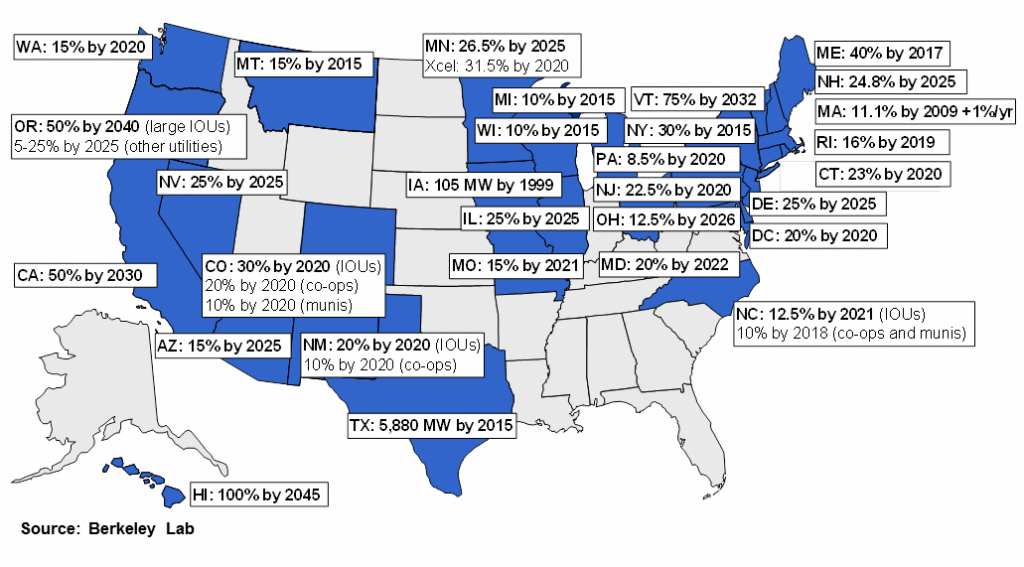
A central element to the work done at the Berkley National Lab is the U.S. Renewables Portfolio Standards Annual Status Report, an annual report published in slide-deck form that describes key trends, including recent legislative revisions, RPS policy design features, past and projected impacts on renewables development, compliance with interim targets, and costs. Data files associated with several elements of this report are also available for download.
Key RPS trends
Listed below are select highlights and infographics from the 2016 edition of the U.S. Renewables Portfolio Standards Annual Status Report:
- RPS policies collectively apply to 55% of total U.S. retail electricity sales
- Significant recent policy revisions include new or increased RPS targets in California, Hawaii, Oregon, Vermont, and New York (in development), while Kansas replaced its RPS with a voluntary goal
- More than half of all growth in renewable electricity (RE) generation (60%) and capacity (57%) since 2000 is associated with state RPS requirements, though other drivers also likely contributed to that growth (infographic)
- Wind energy has been the primary form (64%) of all RPS-driven RE capacity growth to-date, but solar was the largest source (69%) of RPS builds in 2015
- Total RPS demand will double from 215 TWh in 2015 to 431 TWh in 2030; U.S. non-hydro RE generation would need to reach 12.1% of retail sales to keep pace (infographic)
- RPS demand could require an additional 60 GW of RE capacity by 2030, roughly a 50% increase from current non-hydro RE capacity (114 GW through 2015) (infographic)
- Achievement of RPS requirements has thus far been high, with states collectively meeting roughly 95% of their interim RPS targets in recent years (infographic)
- RPS compliance costs totaled $2.6 billion in 2014, averaging $12/MWh-RE and equating to 1.3% of average retail electricity bills; though costs rose from 2013, future growth will be capped by RPS cost containment mechanisms in most states (infographic)
In addition to its annual RPS status report, LBNL has published numerous written reports analyzing specific aspects of RPS policy design and the impacts of RPS policies on electricity and renewable energy markets. These publications include a series of ongoing studies, conducted jointly with the National Renewable Energy Laboratory, that evaluate the costs and benefits of state RPS policies. LBNL staff also frequently provides briefings on state RPS policies to state policy-makers, renewable energy stakeholders, and others.
Data files and analysis
The resources listed below are updated periodically
- U.S. Renewables Portfolio Standards: 2016 Annual Status Report (PDF) (April 2016)
- RPS Compliance Data (XLSX) (last updated February 2016)
- RPS Demand Projections (XLSX) (last updated March 2016)
- Webinar Recording (Clean Energy States Alliance, January 2016)
Filed Under: News, Policy


