Matthew Breakey/Wind Resource Engineer, P. Eng / Wind Energy
Errol Halberg/Manager of Wind Resource Assessment, P. Eng / Wind Energy, GENIVAR Inc., www.genivar.com
Wake validation studies show that a single-turbine wake model under-estimates the wake for turbines affected by multiple turbine rows. A wake combination method, however, can improve the accuracy of wake modeling in deep arrays and better capture their compounding effects.
 Although the name plate capacity of wind power projects has not increased significantly over the past decade, areas favorable for wind development have resulted in clusters of wind farms in excess of 1 GW of rated power. These wind farms are effectively one large project with respect to wind flow and wake modeling. Empirical evidence has shown that wake flow models such as Park, Modified Park, and Eddy Viscosity validate reasonably well for a few rows. However, they under-predict losses for turbines exposed to wake effects from more than three upwind turbine rows[2].
In the context of large clusters of wind farms, accuracy of wake models through multiple rows is increasingly important because individual turbines might be wake affected by dozens of upwind turbines. Under predicting wakes at large row numbers can result in significant under-prediction of the facility’s yield.
Deep array wake models (DAWM) have been proposed by various independent wind flow modeling groups and have shown to improve the overall wake loss for large wind farms [5, 6]. One modeling approach considers a two-way interaction between wind turbines and the surrounding atmosphere. Turbines increase the surface roughness of the project as compared to wind-flow conditions measured during the met campaign. With enough turbines over a sufficiently large area, the roughness difference can significantly affect the wind flow enough to decrease wind speeds across the project and reduce yield comparible to wake effects. Deep-array adjustments have resulted in an improved estimated of wake loss, but is still lacking a prescriptive method that applies to a wide range of wind projects.
The most commonly used wind farm wake models including Park (N. O Jensen – 1986), Modified Park (N. O Jensen – 2005) and Eddy Viscosity (Ainslie – 1988). These single-turbine wake models calculate the wake between a pair of turbines. To complete the wake modeling for a wind farm consisting of multiple turbines, the method must combine multiple wakes intersecting a single turbine rotor. [3,4]. Common wake combination methods include:
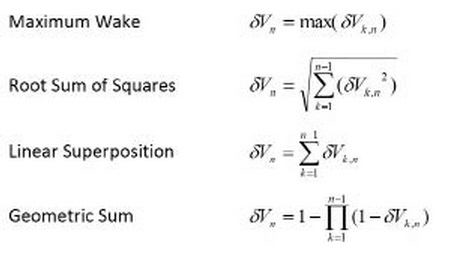
In the equations, ρVn = cumulative velocity deficit due to wake, and n = number of upstream turbines.
The wake-combination method can have a profound influence on the modeled wake for wind turbines affected by multiple upwind turbines. This analysis shows that a discussion of wake models is incomplete without an in-depth discussion of the wake combination methods.
The investigation
Wake losses at a large on-shore wind farm were analyzed in relation to the number of overlapping wakes. The analysis investigated both the influence of deep array roughness and the combination method on the estimated wake by the number of overlapping wakes.
 The net of wake energy yield at each turbine was calculated based on the wake results for turbines grouped by number of overlapping wakes, the modeling scenario, and the yields averaged for each group. The modeled results were then compared to measured production data for each group of turbines. The measured data at each turbine was corrected to 100% availability and 0% under-performance losses, as well as being adjusted to a long-term net of wake yield based on a nearby reference station.
The project is located in simple terrain with little elevation change across rows. The wind farm had a unidirectional wind rose with the predominate wind direction perpendicular to the row direction.
The results are not normalized in relation to the first row. To verify that changes in net wake yield were not influenced by varied wind flow across the project, the average gross yield for each row was calculated using a wind-flow model in the software WAsP. All turbine groups had an average gross yield within -0.9% and +1.8% of the mean gross yield. The variation in gross yield was relatively small compared to the magnitude of the wake loss and was not trended with row depth, thus it had a small influence on the overall results.
To investigate the influence of the combination method on wake, the following three cases were calculated in Matlab and compared to measured results.
1) Standard Park Model (N.O. Jensen) using the root sum squares combination method.
2) Standard Park Model (N.O. Jensen) using a geometric combination method.
3) Standard Park Model (N.O. Jensen) using the geometric combination method and a tuned deep array adjustment.
To investigate the relationship of deep-array adjustment roughness on wakes, the following modeling cases were calculated using WindPRO (wind farm modeling software) and compared to measured results:
1) Standard Park Model (N.O. Jensen) using the root sum squares combination method.
2) Standard Park Model (N.O. Jensen) using the root sum squares combination method with a deep array roughness adjustment.
3) Offshore Park Model using the root-sum squares combination method with a deep array roughness adjustment based on six times the default roughness.
Results and discussion
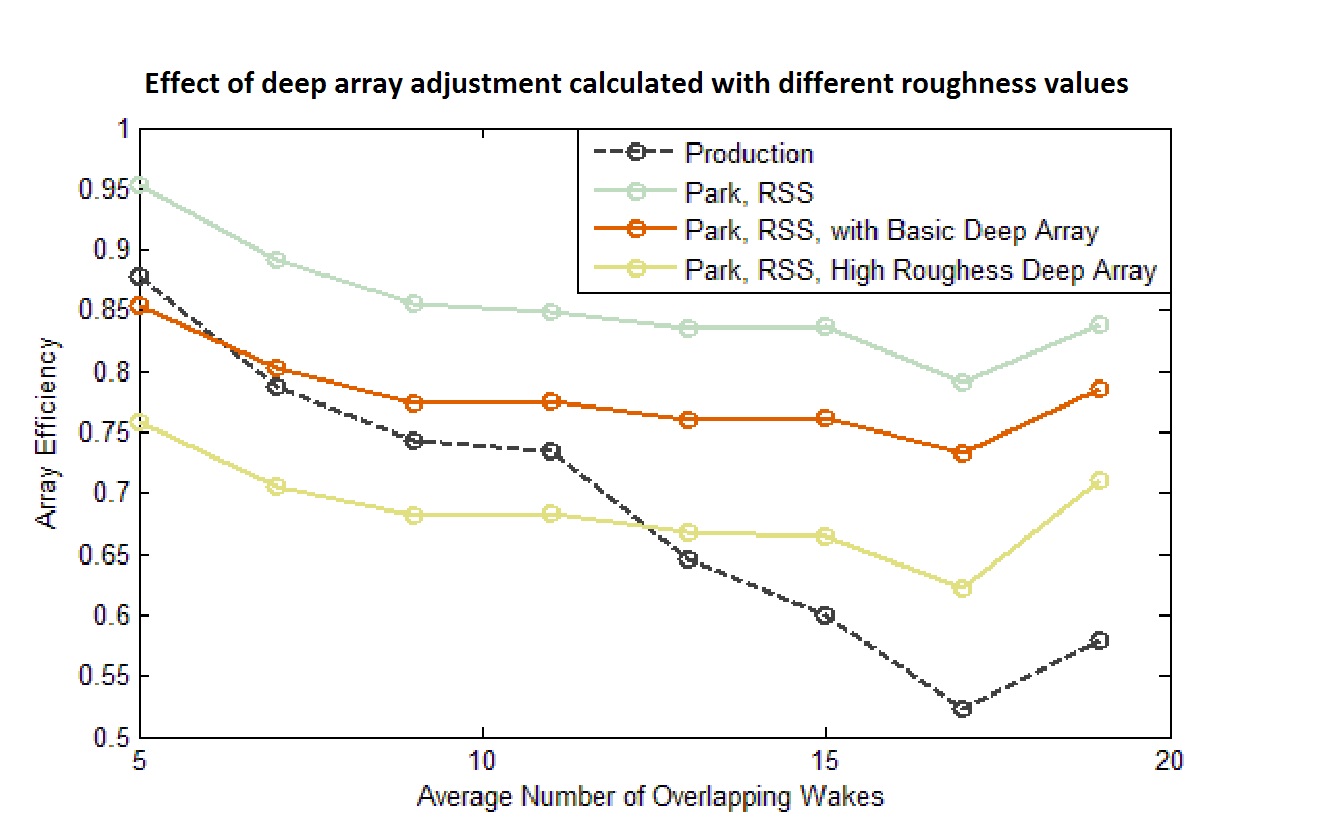
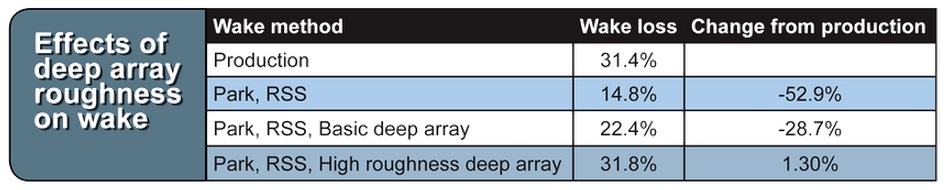
Effect of Deep Array Roughness on Wake, as demonstrated in the accompanying table and presented in literature [5], deep-array parameters can be adjusted so the overall wake better matches the production data. Furthermore, the study’s wind farm is large and the deep array adjustment based on a roughness increase is correspondingly large.
However, the profile of the deep-array calculation does not fully capture the trend of increasing wake with number of overlapping wakes as seen in Effect of deep array adjustment calculated with different roughness values (top most graph). The modeled net of wake yield may be slightly offset due to uncertainty in the WAsP wind-flow model, as well as possible deviations in the published versus realized power curves. However, the trends with respect to row number are unaffected by these possible biases.
The graphs (the first two above) show that the Park Wake model with the root-sum squares combination method under-predicts wake with increased row depth. The DAWM (Deep array wake models) can be used to tune the overall wake loss to match production data, but does not typically improve the trend in wake estimates corresponding with number of overlapping wakes. As such, tuning of this model can be considered site-specific, and may not be transferrable to projects of different sizes and characteristics. Therefore, it is difficult to rely on the DAWM to account for the under-estimation in wake because tuning of pre-construction wake models is not possible and a prescribed method for estimating pre-construction wake for a wide array of wind power projects still requires further validation.
Effect of combination method on wake
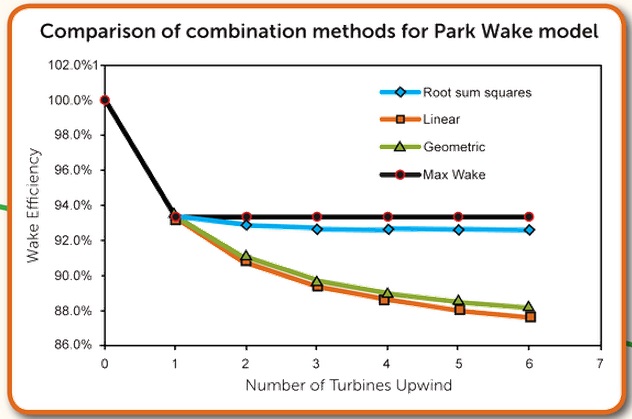
For a demonstration, a sensitivity of the wake combination methods was completed using simplified assumptions. This test case is a theoretical scenario, whereas, wake losses from actual facilities may differ significantly depending on turbine density, turbine characteristics, turbulence, and wind resource intensity. The Park model was used with a row spacing of 10 rotor diameters, a thrust coefficient of 0.7, and a wake decay of 0.065.
The graph Comparison of combination methods (second one above) for a Park wake model shows that the selection of the wake-combination method does not influence results for the first row, but can significantly influence the cumulative wake for downwind turbines. The maximum wake model predicts a wake 36% less than the geometric model at a row depth of 3, and 45% less at a row depth of 6. The graph also shows that the root sum squares combination method produces a result similar to the max wake model for this simple case.
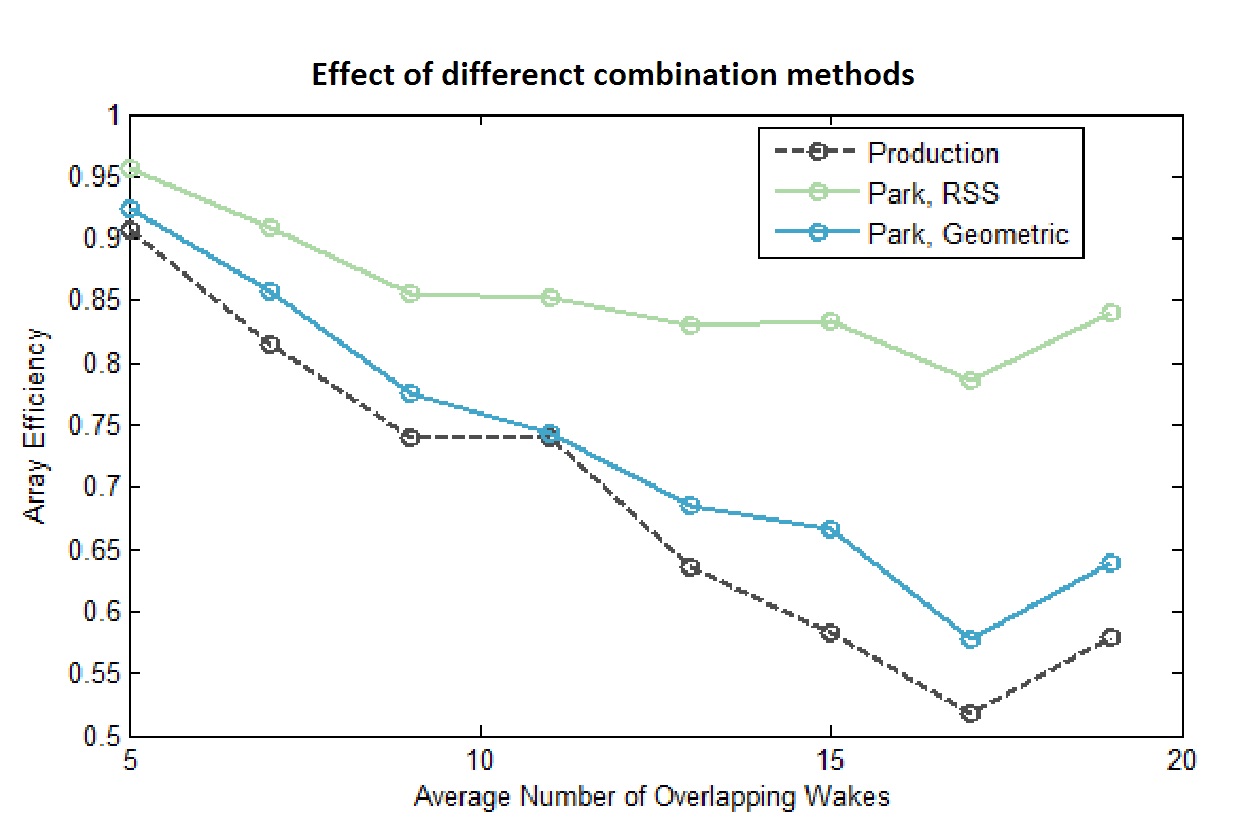
 One notable feature of the wake combination method is that it changes the slope of wake efficiency with row number. Effect of different combination methods shows how the geometric combination method improves the slope with number of overlapping wakes to better match measured values when compared to the root sum squares combination method. Previous presentations and papers published by RES indicate an average between the linear and root-sum-square model best matches the slope of wake with row number, based on their wake modeling procedure [7, 8, 9]. However, the most appropriate combination method will be dependent on the wake model selected, parameters used, and any deep array adjustment applied.
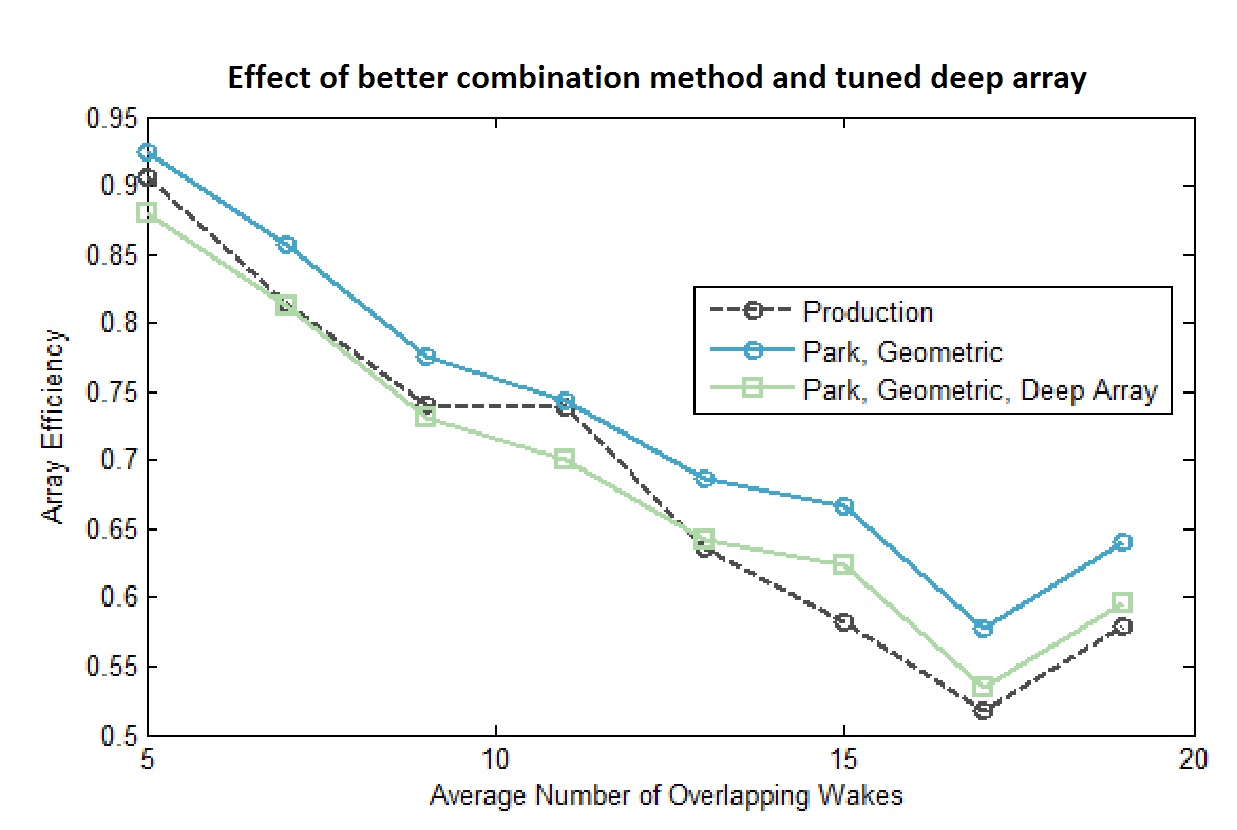
For the analyzed project, the Park wake model with the geometric combination method better matches the change of wake with number of overlapping wakes than does the root-sum-squares method. However, the geometric combination method still under-predicts the magnitude of the wake when compared to measured values. Tuning the wake using a deep-array roughness can match the overall wake for the facility as seen in Effect of better combination method and tuned deep array.
It is common that off-the-shelf, wind-flow modeling packages do not always allow modifying the combination method. This analysis shows that common combination methods, such as the root-sum squares or maximum wake, may under-estimate wake losses for large facilities. An appropriate selection of both the combination method and the deep-array adjustment is required to match the wake distribution between rows as well as the overall wake magnitude.
 Final thoughts
Single wake models such as Park, Modified Park, and Eddy Viscosity require a wake combination method when wake losses from multiple turbines intersect. The combination method strongly influences the estimated wake and plays an important role determining the multi-row turbine wake for large facilities. Wake validation studies show that single wake models under-estimate wake for turbines affected by multiple turbine rows. Deep-array wake models can improve the overall wake loss for the facility, but do not always correctly predict trends in wake with number of overlapping wakes.
Most wind energy software packages implement simplistic wake combination methods such as maximum wake or root-sum squares. These combination methods do not account for the compounding effects of wake from multiple turbine rows and will result in an under-prediction of wake losses. There is a danger that deep array adjustments are used to compensate for a poorly performing combination method. A judicious selection of a wake combination method can improve the accuracy of wake modeling in deep arrays and better capture compounding effects of wake.
Single turbine wake models can still do a good job of estimating wake in large wind energy facilities that use an appropriate combination method and deep-array adjustment. For this study, the Park Wake model using the geometric combination method and a small deep array adjustment was found to match both the magnitude and character of wake observed at a large wind farm. The deep array adjustment was tuned for this specific site, but results cannot be considered prescriptive across a wide range of project types and sizes. More work must be completed on validating the best wake modeling procedure across a wide range of wind power projects. WPE&D
For further reading
1. Hale E. (2012): Observed Wake Impacts in a Stable Environment. AWEA. Pittsburgh
2. Sorensen T., Thogersen M., Nielsen P., Grotzner A. Chun S. (2008). Adapting and calibration of existing wake models to meet the conditions inside offshore wind farms. Ailborg, Denmark: EMD International A/S
3. Thogersen M., Sorensen T., Nielsen P., Grotzner A., Chun S. (2011). Introduction to Wind Turbine Wake Modeling and Wake Generated Turbulence. Ailborg, Denmark: EMD International A/S
4. (2010): OpenWind Theoretical Basis and Validation, Albany, NY: AWSTRUEPOWER, LLC
5. Brower M., Robinson N. (2012): The OpenWind Deep-Array Wake Model. Albany, NY: AWSTruePower, LLC
6. Johnson C., Tindal A., Schlez W. (2009): New Development in Wake Models for Large Wind Farms. AWEA. Chicago.
7. Habenicht G. Comparison of different wake combination methods to model Offshore wakes. RES
8. Habenicht G. (2011): Offshore Wake Modeling. Renewable UK Offshore Wind. RES 9. Alexander S., Healer B., Oliver A., Smith M (2012): Wake Loss Magnitude and Propogation Characteristics for Two Oporating Sites. AWEA. Atlanta: Res Americas
Filed Under: Featured, Projects, Software


Although the NO Jensen model has been around for a very long time, the actual implementation of the model varies widely with significant variation in result depending on the software package. I’ll do my best to provide my experience on the topic.
A) Most wake models have been found to under-estimate wakes in low turbulence intensity wind regimes (on-shore). When measured turbulence intensity for on-shore sites approach that for offshore sites, an off-shore wake decay (0.04) often validates better than default on-shore values (0.063-0.075). I would recommend using an optimization method to determine the site specific wake decay constant that best matches the wind flow conditions for your site.
B) Most of the validation that WSP completes is based on 10-minute energy data for individual turbines. Functionally, we treat a wind turbine as an energy sensor which mitigates many of the problems associated with an anemometer used to measure wind speed. The production data is quality controlled to remove abnormal operation and corrected for long-term operation. We then present our results as an energy loss over an annualized period. The reasons for this is that the weakness of industry standard wake models is not in the calculation of wake given a specific case (turbine A on B for a wind speed of X m/s from direction Y), but the combination of multiple overlapping wakes, over a range of wind speeds throughout the entire wind rose. An anemometers is 10 cm x 10 cm whereas a modern wind turbine is 100 m x 100 m. The wake intersection problem is rarely discussed and can’t be verified by a wind speed measurement. Energy deficits of real turbines over a long period of time are the final answer and mitigate errors associated with over simplifying the problem by only using intermediate measurements. Calculation of the energy of an un-waked turbine is the difficult part. For simple sites, comparison to nearby turbines or a wind rose analysis can usually provide a reasonable estimate.
Good Luck
Dear Sir,
I am a Post-Graduate Student, pursuing Master of Technology (M.Tech) in Computational Fluid Dynamics. I am currently validating Jensen wake model against experimental data. I am referring to a research article of yours. I found your work very valuable and thats why decided to contact you to seek an answer for a query of mine.
My approach:
Experimental data representing 10 minute averages of wind speeds and directions for a particular period (say, 1 year) are obtained. Then, the wind data is divided into 30 degrees direction bins and 1 m/s wind-speed bins.The wake model code is applied on each wind speed for each direction sector.
My questions:
A) How should I estimate the value of wake decay constant(k) in Jensen model? Should I use the values as mentioned in the literature (For offshore cases k=0.04, for onshore cases k=0.075)? Or should I use any optimisation method for this problem like least-square minimization of error etc.?
B) Suppose I got the model estimated wind speed values and their corresponding experimental readings. What are the possible ways of representing and plotting my results so that I can test the accuracy of the wake-model?
Eagerly waiting for your reply and suggestions.
Thanking you
Regards
Zubairkhan Kittur
M.Tech-Computational Fluid Dynamics (4th semester)
UPES,Dehradun,India