Lee Alnes
Lee Alnes / Vaisala Inc.
If you ask to borrow money to develop a wind farm, the lender will ask: How much energy will it generate? Your answer, of course, depends on the wind, a variable resource and one that will significantly affect the cash flow of a wind farm. Measuring and assessing the wind provides investors with valuable information about a project’s risk and potential success.
For over 30 years, meteorological masts – met towers – have served as the primary wind-measurement tool. It’s usually equipped with anemometers, vanes, and data loggers that record wind speed and direction. Nearly every modern wind-power project, collectively worth billions of dollars, has received cost-justification based on one of these devices.
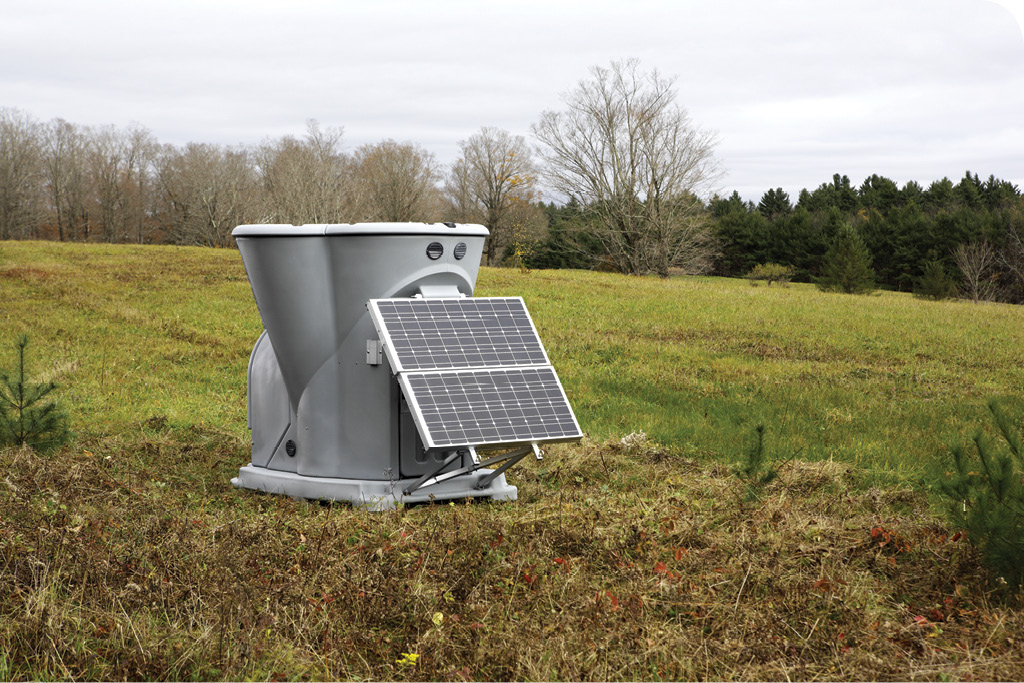
The Vaisala Triton Wind Profiler is a remote-sensing system that measures wind speed and direction as much as 200-m up. It’s been compared to towers in individual validation studies and in a new global study done in conjunction with Vaisala’s customers.
But times are changing. Ground based, remote-sensing technology often supplements today’s towers because remote-sensing technology can measure winds at much greater heights. LiDAR (light detection and ranging) or SoDAR (sound detection and ranging) are remote-sensing methods that use either light in the form of a pulsed laser or sound to measure ranges. The measurements are needed because the industry is building ever-taller turbines (80 to 100 m) to capture the stronger winds higher up.
But met towers don’t usually top 80 meters. They’re also costly to build and complex to install at any height. Most lenders are aware of this. Those holding the purse strings also know that wind measurements taken at lower heights are not ideal and lead to financial uncertainty. So as turbine heights reach beyond the 100-m mark, wind measurements are becoming an increasingly relevant factor in wind-farm financing.
Comparing measurement devices
At some point, nearly every new remote-sensing user asks: “Is this device as accurate as my met tower?” The short and sweet answer is “yes.” In fact, remote sensors are often more accurate than met towers. A number of validation and correlation studies have proven this.
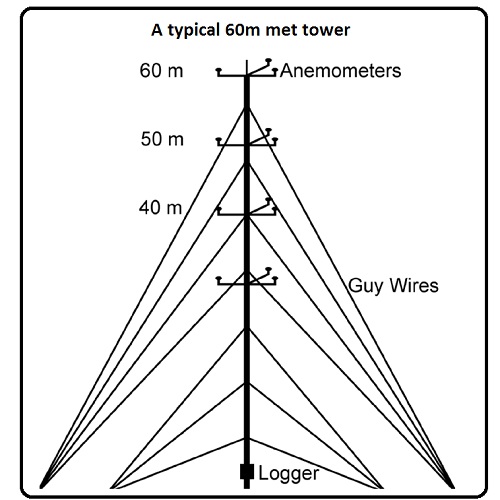
A typical 60-m met tower holds a range of instrument at several levels. However, the tower and guy wires cause some wind-flow disruption.
These studies, often conducted at a wind-turbine test facility, tend to go like this: A remote-sensing system is placed near a met tower for at least four weeks. Afterwards, researchers compare the measurement data from the two systems.
This seems straightforward, but comparing information from wind-measurement devices has its challenges. When comparing remote sensors to tower-based wind measurements, it’s important to first understand the sources of possible error. The following conditions represent some of those potential sources.
• Location. Because it’s physically impossible for a remote sensor to secure the exact location as a tower at the same time, the data collected will already be skewed. This alone will cause the two measurements to differ at least somewhat.
• Tower configuration. Perfect measurements would require mounting a device on an invisible tower that couldn’t alter or divert the wind. But reality shows that a tower affects the wind and impacts related measurement data. This is because wind flows around the tower and can bounce off and over it before hitting the sensor or anemometer.
• Measurement device. By design, a cup anemometer (aptly named because of the cup-like shape of the device that “captures” and measures the wind) reacts more easily to increases in wind speed than it does to decreases, often putting out disproportionately higher readings at higher wind speeds due to gusts. An anemometer can also over-speed in reaction to vertical currents and is affected by the sway of a tower in the wind. In fact, in some wind directions, data from two anemometers at the same height on the same tower can differ by as much as 10%.
Taking these issues into account, the wind industry generally stipulates that most cup anemometers are accurate to within 1 to 2% of actual wind speeds.
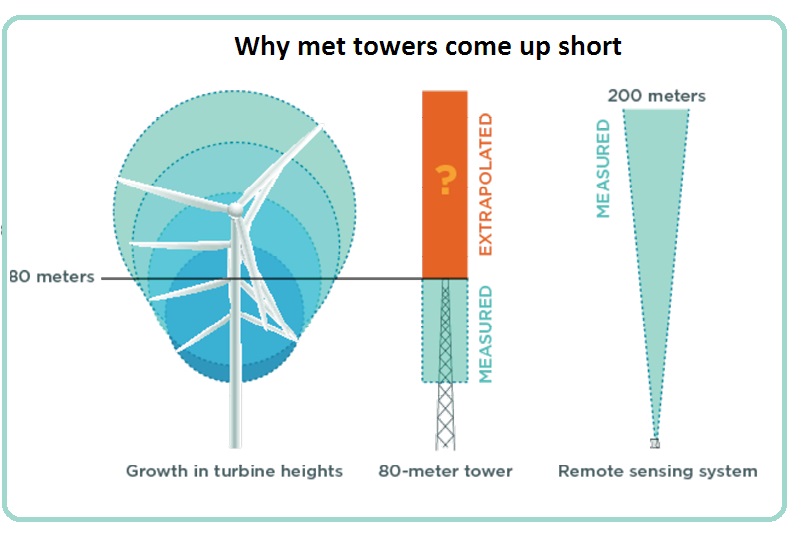
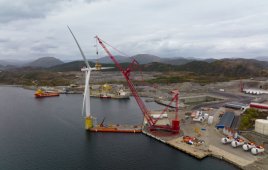
As turbine heights grow, remote sensing plays an increasingly important role in wind measurement.
After data collection comes the tricky process of sorting though or “cleaning and screening” the met-tower information. This is labor-intensive and somewhat subjective. A meteorologist has a variety of choices to make in filtering out data, and must bear in mind that extrapolating data from lower heights to turbine height causes errors. Even the seemingly simple task of averaging wind speeds over time is open for interpretation.
Chances are that no two meteorologists will come up with exactly the same results from the same set of tower data. So it’s important to document all potential physical factors that might affect the outcome. Fully understanding and accounting for the challenges in comparing measurement devices is critical for conducting good studies that produce a scientifically supportable result.
The most important metrics reported by a correlation study are as follows:
• Correlation. Wind speed or direction measurements are compared using the correlation coefficient, r, and the coefficient of determination, r2. A correlation coefficient is a number between +1 and -1 describing the relationship of one variable (for example, the met-tower measured wind-speed data) to another (the remote-sensor measured wind-speed data). A coefficient of +1 indicates a perfect positive correlation (both devices recorded exactly the same thing), and a coefficient of 0 means there was no correlation whatsoever.
The coefficient of determination, r2, is the square of the correlation coefficient and describes how much of the variation in one variable is predictable from the other variable. Sometimes manufacturers will maintain that their system is “99% accurate.” What this actually means is that r2 was 0.99 in at least one correlation study. Because of anemometer uncertainty, one could argue that it’s hardly possible for a system to be 99% accurate.
• Reliability. Even a perfectly accurate instrument is not practical or useful to the wind industry if it’s unreliable or requires constant attention. Reliability is reported as the percentage of time a machine is operational during a test period. Typical met tower reliability targets for the industry range from 75 to 95%. If a system is operational less than 85% of the time during a wind measurement campaign, its results are not trustworthy.
• Data recovery. Tower data recovery is either 0 or 100% within a given time period. The data recovery of a remote-sensing system will vary because of its signal strength, atmospheric conditions, and other factors. Data recovery is usually reported as a performance metric in correlation studies.
The growing number of validation studies has given the wind industry a lot more confidence in remote-sensing data. LiDAR and SoDAR sensors are becoming the routine choice for wind project developers, especially for large-scale wind farms.
Industry experts and researchers have done an impressive job conducting comparisons between remote sensors and traditional measurement technologies. The goal now is to continue this work to help the industry further reduce financial uncertainty and ensure a favorable return-on-investment for wind energy projects. 
Filed Under: Featured