Key findings:
• Overall U.S. energy consumption decreased slightly to 97.4 quadrillion British thermal units (Btu) in 2016—a 0.3% decline from 2015. Compared to 2015, energy consumption increased in 2016 for renewables (+7.3%), natural gas (+3.8%), nuclear (+1.0%), and petroleum (+1.2%). Consumption from coal continued to decline, dropping by 8.5%.
- U.S. electric power sector energy consumption decreased to 37.8 quadrillion Btu in 2016, a 0.8% decline from 2015.1
- In 2016, U.S. renewable electricity2 grew to 18.3% of total installed capacity and 15.6% of total electricity generation. Installed renewable electricity capacity exceeded 214 gigawatts (GW) in 2016, generating 640 terawatt-hours (TWh).
- The combined share of wind and solar generation (294 TWh) continued to grow in the United States in 2016, exceeding generation from hydropower (266 TWh) for the first time. U.S. hydropower produced nearly 42% of total renewable electricity generation, wind produced more than 35%, solar (photovoltaic [PV] and concentrating solar power [CSP])3 produced nearly 11%, biomass produced 10%, and geothermal produced nearly 3%.
- In 2016, renewable electricity accounted for 67% of U.S. electricity capacity additions, compared to 64% in 2015. Coal-fired generation comprised nearly 80% (7.6 GW) of retirements in 2016.
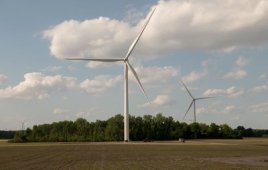
- In 2016, installed wind capacity increased by more than 11% (8.2 GW), accounting for more than 40% of U.S. renewable electricity capacity installed in 2016. U.S. wind generation increased by nearly 19% compared to 2015, and it reached a total of 226 TWh by the end of 2016.
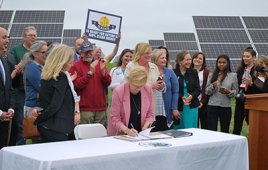
• U.S. solar electricity installed capacity increased by 52% (11.4 GWac or 14.8 GWdc4 ), accounting for nearly 57% of newly installed U.S. renewable electricity capacity in 2016.5 Solar generation reached a total of 64 TWh in 2016.
• U.S. hydropower capacity remained relatively stable from 2000 to 2016. U.S. biomass and geothermal electricity capacities saw relatively steady growth between 2000 and 2016.
• Installed global renewable electricity capacity continued to increase, and it represented 31% of total electricity capacity worldwide in 2016.6
• Worldwide, solar PV continued to be one of the fastest-growing renewable electricity technologies in 2016, as global PV capacity increased by 33%.
• Globally, new investments in clean energy in 2016 fell by nearly 18% from 2015 to $288 billion.
From the wind summary
- In the United States, wind installed capacity grew 11% in 2016, compared to 12.3% in 2015. Nearly 8.2 GW of additional wind capacity was installed in 2016, leading to a total cumulative capacity of more than 82 GW.
• States with some of the highest cumulative wind installed capacity also experienced the most growth in capacity in 2016, including Texas (2.6 GW), Oklahoma (1.4 GW), Iowa (0.7 GW), and Kansas (0.7 GW).
• Global cumulative installed wind capacity reached 487 GW in 2016.
• In 2016, China continued to lead the world in cumulative installed wind capacity, with capacity additions of over 23 GW.
• The first U.S. commercial offshore wind farm—off Block Island (Rhode Island)— commenced commercial operation in December 2016. Globally, offshore wind installed capacity grew to 14.4 GW.
Footnotes
1 Source: U.S. Energy Information Administration (EIA); full references are provided beginning on page 123.
2 Renewable electricity includes solar, wind, geothermal, hydropower, and biopower unless indicated otherwise.
3 Reported solar data combine PV and CSP unless indicated otherwise.
4 Capacity estimates are derived from the Solar Energy Industries Association/Greentech Media (SEIA/GTM) Solar Market Insight 2016 Year-in-Review report; reported solar electricity capacity additions for 2016 were since revised in the SEIA/GTM 4Q 2017 Solar Market Insight report, to 15.18 GWdc.
5 Capacity data are reported in watts of alternating current (ac) unless indicated otherwise; data include the grid-connected residential, non-residential, and utility market segments.
6 Source: EIA
Filed Under: Uncategorized