Editor’s note: Why did not someone think of this before? Bird migration forecasts come from the Cornel Lab of Ornithology.
Migration is the best time to be a bird watcher. Twice a year, hordes of birds travel thousands of miles to grace your home turf for a few days or weeks. But they don’t come in a steady stream—more like a cascade of arrivals coming in flurries and pauses. That’s why even during peak migration, some days are dead while others are packed with new arrivals.
Now, our BirdCast project can help you know when those flurries are about to arrive, so you can plan when to get up early. They’ve boiled down decades of migration science, coupled it with real-time weather data, and created two simple tools: a 3-day migration forecast, and an up-to-the-moment replay of migration activity. We checked in with BirdCast’s Kyle Horton and Adriaan Dokter for some pointers:
First, check the migration forecast
Use the bird-cast this way.
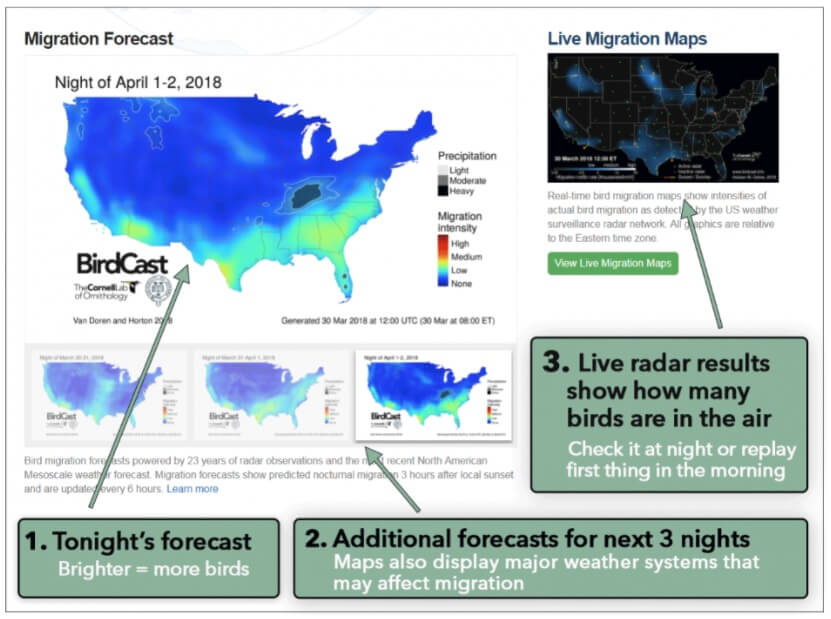
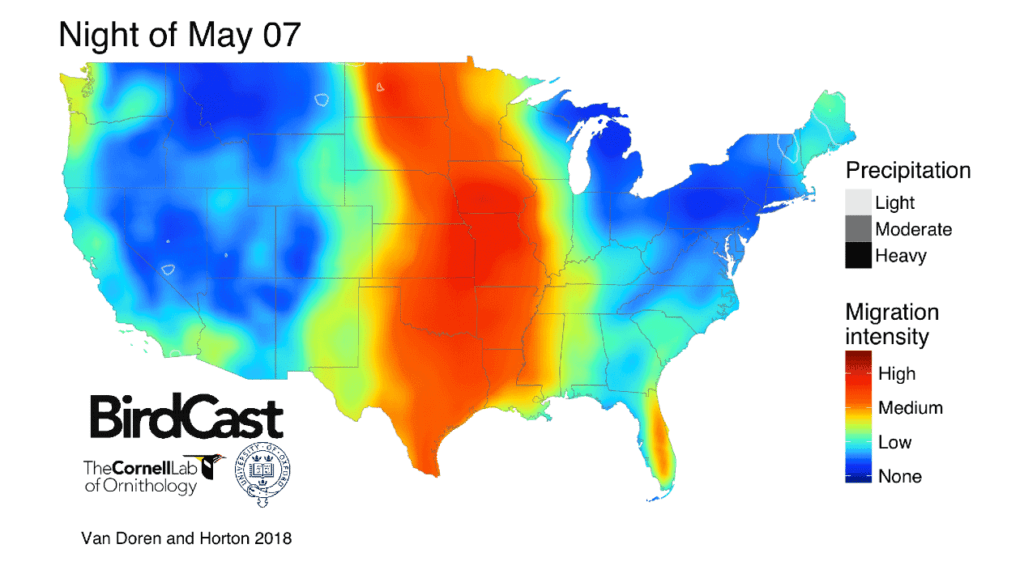
On the forecast maps, bright colors (yellows and reds) indicate more predicted activity than cooler colors (blues and greens). This is a sample map from May 2017; see BirdCast for the most recent forecast maps. Image by Benjamin Van Doren and Kyle Horton.
That large, colorful map on the left of the BirdCast page shows the forecast for tonight’s migration. Below it are thumbnails of predictions for the next three nights (click or tap to see full images). The idea is that by casting your eye over these maps, you can compare how the next few nights stack up. The maps are produced by BirdCast’s Benjamin Van Doren and Kyle Horton.
The magic of the forecast maps is that they compile more than 20 years of data on when migrants are on the move and mash it up with meteorological data including wind speed, direction, barometric pressure, and temperature. You no longer have to have a Ph.D. in migration ecology to use all these variables: just look for the brightest colors on the maps to know when to go.
Watch for storms
Birds typically migrate during clear weather and drop to the ground when it starts raining. The forecasts alert you to this by showing major weather systems on the maps. As many birders have long known, nighttime storms on a busy migration night can drive migrants to land, creating great birding in the morning (the Gulf Coast’s spectacular “fallouts” are the classic example of this). Conversely, a storm can create a migration barrier and keep birds from reaching the far side of the system. So when looking at the forecasts, keep an eye out for weather systems, shown on the maps in gray and black.
Use the live maps for a reality check
Like all forecasts, a migration forecast is a prediction based on computer models—it’s not always right. That’s where that mostly black map on the right of the BirdCast page comes in—it’s a live radar map that shows actual bird activity in the sky in near real time.
This is a sample map from May 2017; see BirdCast for the most recent forecast maps. Image by Benjamin Van Doren and Kyle Horton. Pick on the map for a larger version.
Example of migration activity data over a single night in May 2017, as measured by 143 radar stations across the U.S. The red line shows sunset; yellow line represents sunrise. See most recent maps at BirdCast. Image by Adriaan Dokter.
Click or tap on that black map to bring up an animated version that loops through the night’s activity, showing an estimate of how many birds are moving in your area. The maps use data from 143 radar stations that update every 10 minutes, compiling about 100 gigabytes of data every night via an algorithm designed by BirdCast’s Adriaan Dokter.
Amazingly, the radar data can even reveal which direction the birds are flying. It turns out they don’t all fly due north in spring and due south in fall. Check the orange arrows to see where the birds are headed—it might help you decide where in your area is the best bet for birding.
You can check these maps during the night or look at them first thing in the morning, when you can play back the activity over the whole previous night (from sunset on the East Coast to an hour after sunrise on the West Coast). Controls on the player let you pause, rewind, speed up, slow down, or advance the playback one frame at a time.
And don’t worry that you have to stay up till dawn obsessively refreshing the page for the latest data (unless you want to, of course). Migration flights typically peak a few hours after sunset, so if it looks good at 10 p.m., it will probably still be good in the morning.
Conservation is the end goal
These new tools are a gift to bird watchers looking to fine-tune their birding schedule—but Horton, Dokter, and the rest of the BirdCast team have a bigger goal. By creating accurate forecasts and up-to-the-minute monitoring tools, they hope to provide tools for managing wind turbines and city lights. Collisions with lighted windows (and, to a lesser extent, wind turbines) are a major cause of bird death. But the majority of migrants come through on a few nights each year, meaning that fairly minor, temporary adjustments could save huge numbers of birds.
Here’s the fine print:
The BirdCast maps make the most of the available data and models and have undergone significant testing. Still, Horton and Dokter outlined a few caveats to bear in mind as you start to use the maps.
- Coverage is limited to the U.S.—why? We agree it would be great to extend these maps to Canada and Mexico, but the radar infrastructure and the real-time data connections don’t currently allow that.
- Migration strength is relative to the whole country. On the forecast map, migration activity is shown on a blue-yellow-red scale. High-migration areas such as the Gulf Coast and the Mississippi Flyway will reliably turn red during peak migration; but other parts of the country, such as the Rockies, will rarely show red, even on locally good nights, because they don’t reach the same level of activity.
- Bird numbers are approximate. The real-time migration maps estimate activity in thousands of birds per kilometer. These numbers are based on songbird-sized birds—it’s possible that there could be smaller numbers of larger birds creating the same signal.
- Radar can’t tell bird species. Radar data can tell us a lot, but at the moment it can’t tell us which species are migrating. The maps can tell you when birds are moving—figuring out which ones is up to you.
- Flight direction is sometimes wrong. The flight direction arrows calculate an average direction for all the birds moving over a fairly large area—so sometimes they point in unexpected directions. They should be used as a general indication rather than a precise number.
Filed Under: O&M