Ryan Blitstein / Director of Renewable Energy / Uptake

Ryan Blitstein
Watch most any spy movie and you’ll see a command center with walls covered with computer screens. The hero may view satellite data while numbers scroll and images flash across other monitors. The hero takes it all in, makes a decision, and saves the day.
Now walk into a typical wind-farm operations center and you’ll largely see the same thing. One screen plots graphic trends from wind-turbine SCADA systems while another screen provides the same information but for turbines from a single manufacturer. More screens connect to internal databases for parts, materials, work order information, and more.
Unlike in the movies, a wind-farm O&M center with many screens displaying information from different systems does not save the day. It makes work harder and longer, and decisions more confusing. It also threatens to undercut the promise that predictive analytics holds to make the wind industry more productive, reliable, safe, and secure.
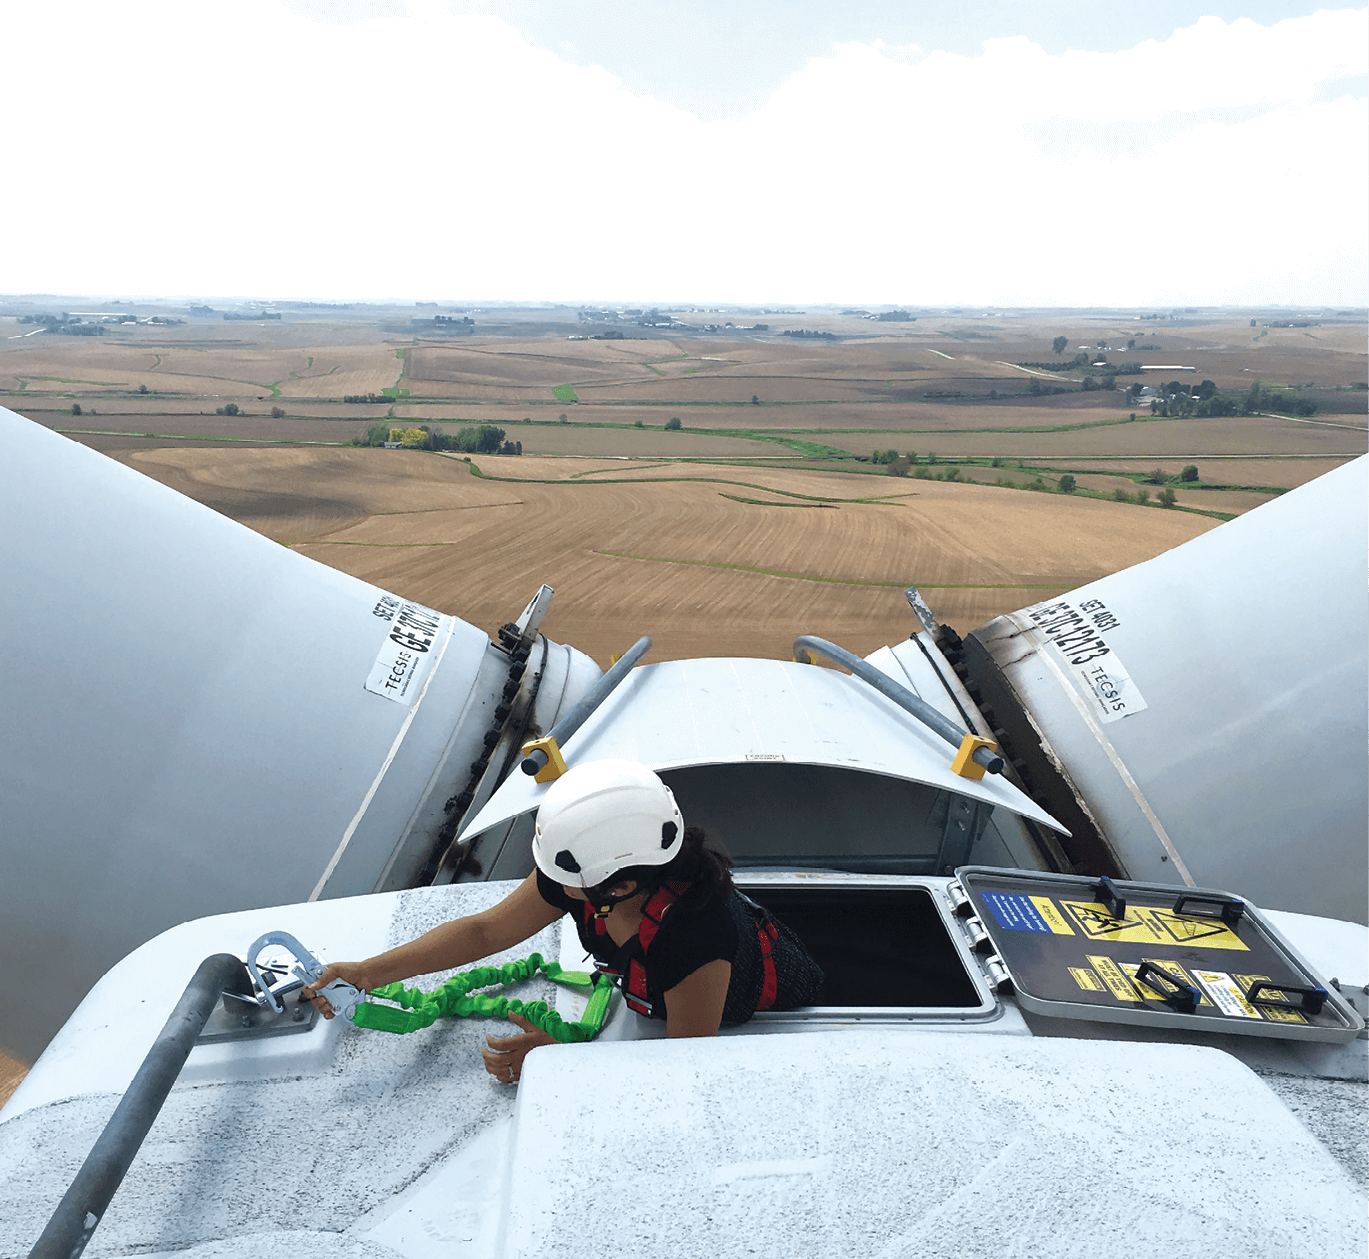
A software developer from Uptake joins a technician atop a wind turbine in Iowa to better appreciate the data the tech needs. The best predictive analytics software will be easy to use by technicians despite their challenging physical environments.
What O&M software should do
As more predictive-analytic software enters the market, those most successful will provide intuitive features. The software will be built around users’ needs, and reduce the number of screens to a few, so the right people take the right action at the right time.
Today, we can generate insights that predict a part failure before it happens, thanks to massive amounts of data coming from sensors throughout a wind turbine and significant advances in data science. But those insights are meaningless until a technician in the field or a remote-monitoring center takes action. If workers have tasks they must perform every day, but the software makes each task more cumbersome, the tasks may not get done. This means preventable problems may go unaddressed, leading to higher costs and turbine downtime for wind operators.
Last year, research firm Forrester found that clunky and confusing software prevented workers from quickly accessing critical information needed for their jobs. The same survey found that 65% of workers ignored data needed to make decisions because it had to be pulled from several different systems. Sixty-two percent delayed completing a task because of multiple system login requirements.
To ensure productive action
One way to guarantee that action is taken: Create a user experience that is useful, enjoyable, and helps people do their jobs. The value of predictive analytics is that it is unconstrained by current data science capabilities. The real challenge is getting those predictions into the hands of the right people, in a way that they can easily use the information.
Give an iPhone to a four-year-old or an 80-year-old, and they will likely be able to use it with a little training. The operations of wind companies are certainly more complex than a typical mobile app, but the industrial world stands to benefit greatly from the user experience research and design techniques of the consumer world.
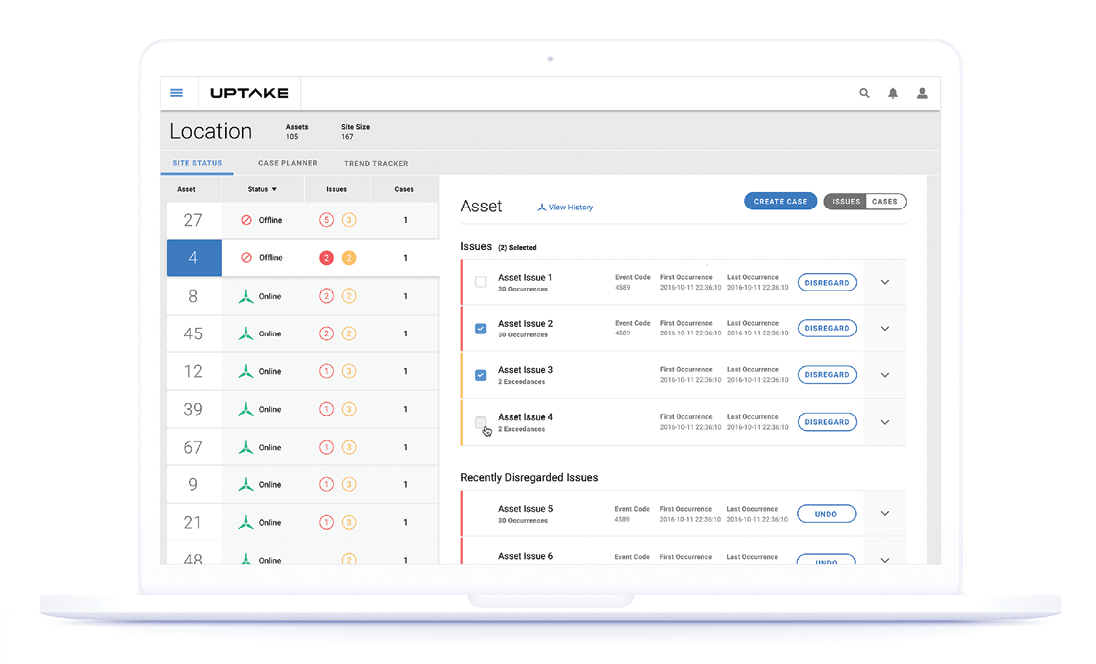
Easy to understand data gets attention and action. There is little deciphering to the data that reports on the condition of site 167. Assets 27 and 4 are offline. The problems with Asset 4 appear under the View History column to the right.
To achieve this, leading predictive analytics developers will build software around users, not data. However, developers will need to do more than just collect and provide data. Each user—from technician to CEO—has different day-to-day problems and uses different segments of data to solve them. If developers can learn how each section of a workforce operates and understanding the workflow, they can improve the predictive software’s user interface. For example, a software developer may have to climb a turbine tower with a wind technician to understand the work environment. This may lead to an interface that works within the environment’s physical constraints.
While a user interface can be tailored for different roles, it should be built on the same data to provide everyone a single version of “the truth.” The CEO’s high-level overview should be generated from the same data that the wind-farm operations manager uses to cut work orders for technicians.
Earlier this year, users at two of Berkshire Hathaway Energy’s subsidiaries had the opportunity to test the predictive-analytics software they chose for their wind fleets. The developer of the predictive analytics software, Uptake, asked the customer to use it for a few hours and then come back and report what they didn’t like. The users reported that certain information was too high level while other information was too detailed. The feedback led to changes in the software and greater use to stop problems before they start.
Building intuitive software for the industrial space requires fixing technical bugs and improving the product and business processes. Just as data science models get “smarter” with more data from sensors, those models can also get smarter when technicians provide feedback on the quality of a recommendation.
Finally, when decisions must be made, knowing the full extent of a wind operator’s data and centralizing it (data from an IT system, workflow, parts inventory, and key performance metrics among others) provides a full picture. This effort allows minimal training once the switch is flipped on. Intuitive software can save time and provide more efficient insight, and help operators do their jobs better.
Having just one screen at a control center with a single view of the world won’t excite Hollywood. But intuitive predictive-analytics software that forecasts problems before they occur, lets workers solve them before an unplanned turbine shutdown. And that is more heroic than anything on the big screen. 
Filed Under: O&M, Software