Windpower Engineering & Development

  • Home
  • Articles
    • Most recent posts
    • News
    • Featured
  • Resources
    • Digital issues
    • Podcasts
    • Suppliers
    • Webinars
    • Events
  • Videos
  • 2025 Leadership
    • 2024 Winners
    • 2023 Winners
    • 2022 Winners
  • Magazine
  • Advertise
  • Subscribe

EIA updates layers to U.S. Energy Mapping System

By Michelle Froese | March 13, 2018

The Energy Information Administration’s (EIA) U.S. Energy Mapping System is an interactive, comprehensive visual reference for energy infrastructure in the United States.

Wind-farm turbine maps (IEA)

Users of the U.S. Energy Mapping System can sign up for email alerts to receive notifications of mapping system updates here.

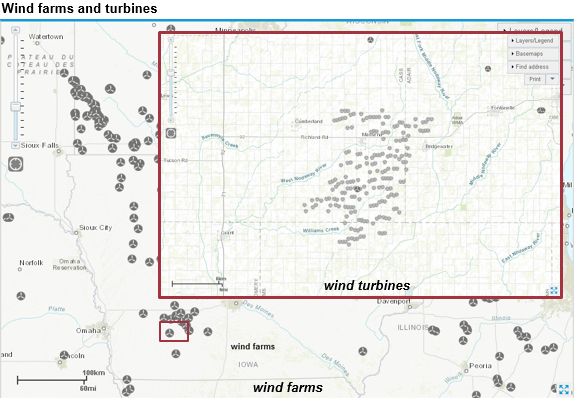
Several layers in the system were recently updated, allowing users to see locations of several types of energy infrastructure, including wind turbines, natural gas pipelines, high-voltage electric transmission lines, natural gas pipelines, U.S. border-crossing points of electric transmission lines, and other energy infrastructure.

Most of these layers are sourced from EIA surveys or other U.S. government sources such as the Federal Energy Regulatory Commission, U.S. Geological Survey, U.S. Bureau of Ocean Energy Management, and the Homeland Infrastructure Foundation.

EIA creates some layers by compiling information from publicly available data sources. Because these sources may contain information at different scales with varying levels of accuracy, some layers, such as pipelines at border crossings, are not visible when zoomed in at closer scales.

Layers created by EIA or based on EIA surveys are also provided as shapefiles that users can combine as layers with information from other sources and can use to conduct their own geospatial analysis. In some cases, shapefiles may not be available because of copyright restrictions from the data source.

Updates to these layers also include more recent information for many of the interactive energy infrastructure maps EIA provides, which can be seen online here. EIA’s State Energy Profiles show these map layers and highlight energy facts for each of the 50 states, the District of Columbia, and U.S. Territories based on information in EIA’s State Energy Data System.


Filed Under: News, Projects


About The Author

Michelle Froese

Related Articles Read More >

US government allows Empire Wind offshore project to resume construction
Overlooked and underleveraged: Why ‘lite repowering’ is wind energy’s best near-term bet
79 aging wind turbines brought back online throughout Texas panhandle
Data center signs 166-MW PPA with Las Majadas Wind in Texas

Podcasts

Wind Spotlight: Looking back at a year of Thrive with ZF Wind Power
See More >

Windpower Engineering & Development Digital Edition Archive

Digital Edition

Explore the full archive of digital issues of Windpower Engineering & Development, presented in a high-quality, user-friendly format. Access current and past editions, clip, share, and download valuable content from the industry’s leading wind power engineering resource.

Windpower Engineering & Development
  • Wind Articles
  • Solar Power World
  • Subscribe to Windpower Engineering
  • About Us/Contact Us

Copyright © 2025 WTWH Media LLC. All Rights Reserved. The material on this site may not be reproduced, distributed, transmitted, cached or otherwise used, except with the prior written permission of WTWH Media
Privacy Policy | Advertising

Search Windpower Engineering & Development

  • Home
  • Articles
    • Most recent posts
    • News
    • Featured
  • Resources
    • Digital issues
    • Podcasts
    • Suppliers
    • Webinars
    • Events
  • Videos
  • 2025 Leadership
    • 2024 Winners
    • 2023 Winners
    • 2022 Winners
  • Magazine
  • Advertise
  • Subscribe