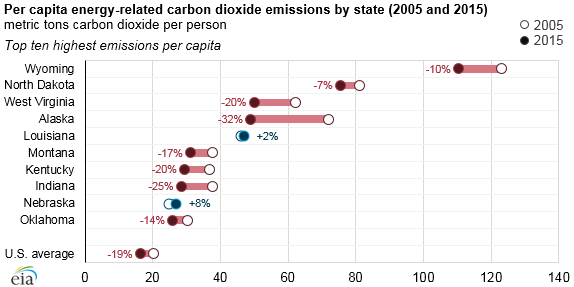
 The United States has a diverse energy landscape that is reflected in differences in state-level emissions profiles. Between 2005 and 2015, energy-related carbon dioxide (CO2) emissions decreased in 43 states (including the District of Columbia) and increased in 8 states. On a per-capita basis, energy-related CO2 emissions decreased in 49 states (including the District of Columbia) and increased in 2 states (Louisiana and Nebraska) between 2005 and 2015. EIA’s latest data on state-level energy-related CO2 emissions include data organized by fuel and by sector.
EIA’s analysis measures emissions released at the location where fossil fuels are consumed. When fuels are used in one state to generate electricity that is consumed in another state, for example, emissions are attributed to the state where the generation occurs.
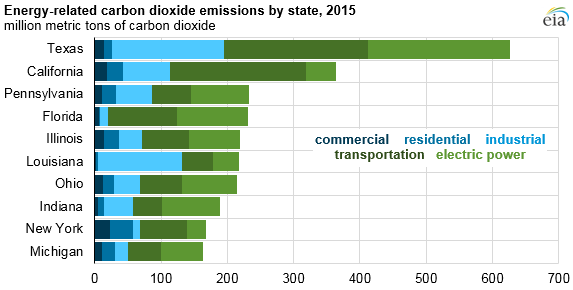
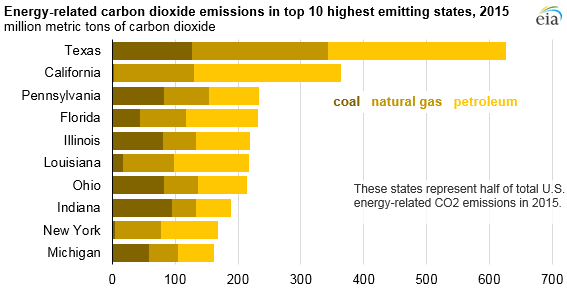 The 10 states with the highest total energy-related CO2 emissions in 2015 accounted for half of the U.S. total. These 10 states also have large populations and account for slightly more than half (51%) of the nation’s total population. California was the second-highest emitter in absolute terms (364 million metric tons of carbon dioxide, or MMmt CO2), behind Texas (626 MMmt CO2). However, California was also the third-lowest emitter on a per capita basis, behind the District of Columbia and New York. Two states with relatively small populations, Wyoming and North Dakota, had much higher levels of per capita emissions—nearly seven and five times the national average, respectively—because both states are large energy producers and, therefore, emit CO2 related to the production of coal, oil, and natural gas.
 Energy-related CO2 emissions are the result of coal, petroleum, and natural gas consumed within a state to produce electricity (36% of U.S. total), to transport goods or people (35%), to operate industrial processes (18%), or to directly fuel equipment in residential and commercial buildings (11%). The consumption levels by fuel and by sector vary considerably by state. For example, in 2015 coal consumption accounted for 75% of energy-related CO2 emissions in West Virginia, although, in California, coal only accounted for 1% of emissions.
Consumption of petroleum in Hawaii and Vermont accounted for 92% and 89% of energy-related CO2 emissions respectively, but for different reasons. In both states, emissions from the transportation sector accounted for more than half of energy-related emissions. In Vermont, the non-electric (or direct) residential share of total emissions was 23%, mostly from the use of petroleum-based fuels such as heating oil to fuel furnaces and water heaters. Vermont had virtually no electric power sector CO2 emissions in 2015. Hawaii, on the other hand, has very little direct use of petroleum for residential heating applications, however, a much higher amount of petroleum is used for power generation.
Filed Under: News, Policy


