A Failure Mode and Effects Analysis (FMEA) is used to evaluate how torsional oscillations and reversals can damage many expensive turbine components. It also compares the effects of adding a Reverse Torsional Damping device to mitigate the damage. The FMEA calculates a projected range of cost reductions based on the credibility of evidence, contribution to overall failure mode, and the estimated life extension from the damping device.
Scott Eatherton • President • Wind Driven LLC.
Emil Moroz • President • EM Energy LLC.
Dustin Sadler • Principal Engineer • AeroTorque Corp.
Dave Heidenreich, P.E. • Founder and Retired Chief Engineer of PT Tech, Inc.
Today’s utility-scale wind turbines are uniquely challenged in the variety and severity of transient torsional events (or TTEs) that can cause potentially damaging torque reversals and high-amplitude torsional oscillations [4].
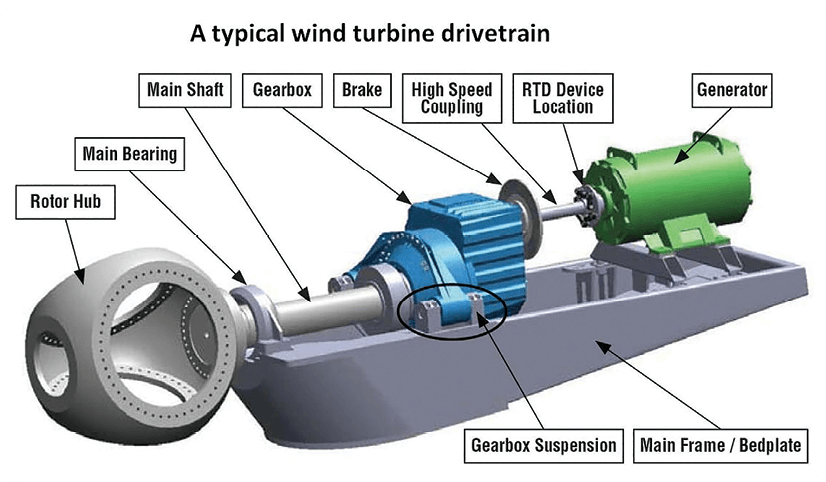
The illustration provides the general layout of a typical wind-turbine drivetrain. Illustration: NREL
An RTD (Reverse Torsional Damping) device, a special type of torsional damper, limits torsional oscillations in turbine drive components during transient events. A typical turbine drivetrain shows that the device would mount on the generator. During normal turbine operation, there is no damping or other impact on power production.
An RTD device can be installed on the generator shaft and adapted to the existing high-speed coupling, providing an economical and easily “retrofittable” mechanism to mitigate the damaging effects of TTEs.
Real-world recordings of torsional load in drive systems of many different turbine models show that the worst torsional vibrations and torque reversals generally occur during transient events, such as emergency stops, grid faults, and many other hard stops. These are detrimental to bearing and gearbox life. The Failure Mode Effects Analysis or FMEA covers this in detail. Less well understood are the ways these loads may impact other turbine components.
Many types of machinery see transient loads during startups, shutdowns, and events of unusual severity. However, they rarely result in a significant reversal of drive-system torque unless it is intended to operate in reverse, in which case reversals are smooth and controlled.
In modern wind turbine designs, blade pitching protocols provide the primary means of braking. Many events can trigger a stop command that results in the blades pitching rapidly to decelerate the turbine. Most of this aero-braking effort goes into decelerating the mass of the rotor, but a portion of the braking goes throughout the drive system to decelerate the rotating mass of the generator. For example, the left plot in Aero-Braking only during a hard stop shows the recorded main-shaft torque during aerobraking. It causes torque reversals equal to 75% of turbine rated torque and excites significant torsional oscillations at the natural frequency of the blades in the drive system.
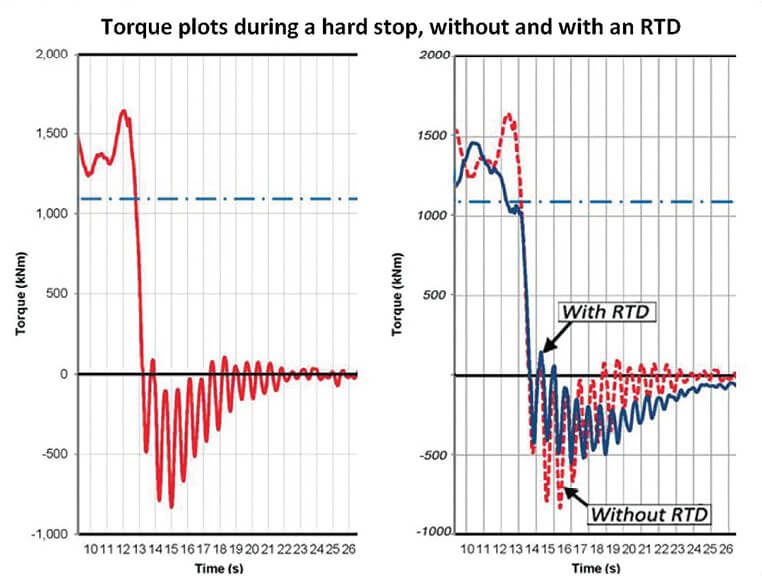
The red plot on the left is overlaid (to the right) with recorded (blue) torque data of the same hard stop from a nearby turbine with an RTD device installed. Both plots were recorded on 1.65-MW turbines with aero-braking only.
The blue line of the overlaid torque plot (left) shows the same aero-braking stop recorded on a nearby turbine equipped with an RTD device. Negative torque excursions were limited to 40% of rated turbine torque throughout the drive system and the amplitude of the oscillations has been reduced by almost 50%. The damping action has effectively limited the torsional elastic energy that is stored in the drivetrain during the aero-braking.
A hard stop is defined in this report and characterized as a rapid shutdown procedure initiated by the control system or by operator intervention, triggered by a stopping protocol using the emergency-stop function. In more critical hard stops, including many emergency stop protocols, caliper-braking is triggered simultaneously with maximum aerobraking. The caliper-braking effort is divided, with most of the braking effort going toward slowing of the blade mass.
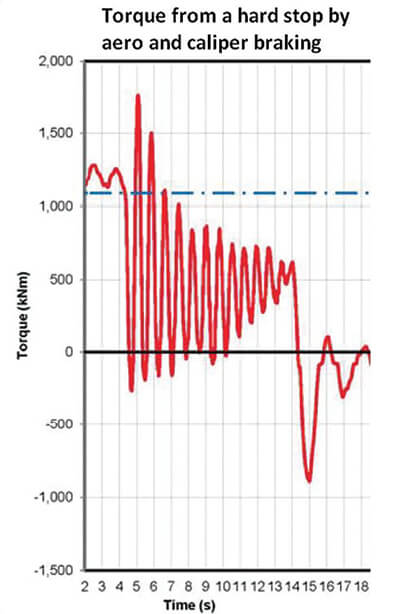 Caliper braking causes a torque in the gearbox and main shaft that is large enough that the combined aero and caliper braking is seen as generally positive. A highly oscillating torque, is shown in Torque from a hard stop). It was recorded on the main shaft of a 1.65-MW turbine without an RTD device. The amplitude of these torsional oscillations is far greater than any recorded during normal turbine operation, and is reasonable expected to add to the cumulative fatigue damage of many turbine components.
Combined aero and caliper braking also shows a large torque reversal that begins at 14 seconds, when the shaft rotation stops due to caliper braking. While torque reversals in general damage the drive-system bearings, a torque reversal of this magnitude can be more damaging when bearings are not rotating, such as during a shut down. The potential for surface damage is further exacerbated when the stationary bearings are subject to simultaneous axial forces and movement. This is true for gearbox bearings that support helical gears and for the main-shaft bearing, which is restraining the high fore and aft oscillations of the tower during the stop. For instance, gearbox borescope inspections of many bearings, high speed to low speed, have produced convincing evidence linking TTEs to scuffing and secondary abrasive cutting wear [6]. Torque reversals also promote bending fatigue damage in gear teeth.

The red dashed plot is from the previous illustration. The blue is from a nearby 1.65-MW turbine equipped with an RTD. Both stops combined aero and caliper braking.
Hard stops on turbines with and without an RTD shows the torsional behavior of the turbine with an RTD device in solid blue line overlaid onto the turbine without it, during side-by-side monitoring of the same hard stop. The damping action reduced the magnitude of the oscillation by more than 70%, effectively limiting the torsional energy that was stored in the drive system and protecting the gearbox and other drive components from the worst torsional vibrations. More importantly, the overlaid plots show that the reverse torsional-damping action almost eliminates the large torque reversal when the shaft rotation stops.
Research shows that such reductions in high-torsional oscillation amplitudes and torque reversals will provide significant life improvement to the gearbox and its bearings, and could reduce O&M costs to most of the drive system and many other turbine components. The Life-Cost-Based FMEA detailed in the second article of this series, is intended to help quantify the resulting cost benefits.
Explanation of the FMEA structure
To best understand the FMEA structure, the discussion is split into life cycle costs, and the potential life-extending effects of RTD devices on failure modes. To populate the FMEA spreadsheet, the authors used this hierarchy of preferred references:
- Wind turbine, bearing, and gear standards,
- Commonly available public documents and sources,
- Turbine operation first-hand experiences, and
- Best estimates based on experience.
To identify components to focus on, a traditional FMEA uses a Risk Priority Number (RPN), which is the product of severity, occurrence rates, and detectability. This FMEA model was based on a modified RPN number created to quantify the benefit of the overall wind-turbine system from an RTD device in the drivetrain. The FMEA calculates a projected range of cost reductions based on the product of the credibility of evidence, contribution to overall failure mode, and the estimated life extension from an RTD device.
The FMEA model is based on a generic list of known issues affecting turbines in the 1.5 to 2.0-MW range. It is important to note that not every individual turbine will experience failure on all listed components. That is, a turbine with a component designed and or manufactured in a certain way may have less (or more) incidence of a particular failure. It is believed that the value of this particular FMEA can be enhanced when populated using site-specific values taken from the statistics from one particular turbine type, in one location, by one owner.
Such an approach would provide the necessary backup for a strong site-specific business case, and should support the installation of RTD devices. The more generic case presented in this article is a conservative estimate of what an operator may expect from such an exercise. It provides a useful benchmark for any site-specific version of an FMEA and draw attention to several chronic and acute modes.
Estimates of gearbox repair costs have a wide range in the FMEA model. Lacking sufficient public domain cost data, it was necessary to make assumptions, such as:
- Repair parts and work are of high quality. For example, that proper bearing heating is used.
- All bearings are replaced when a shaft assembly is repaired.
- For a minimum cost, damage is confined to a single part and the repair is done under ideal conditions.
- For a maximum cost, everything that could go wrong would go wrong, and there is secondary damage from the failure. For example, housing bore damage, metal fragment contamination of the entire filtration and cooling systems, planetary failure with housing rupture, and the associated clean up. The ratio between bearing and gear failure rates for each of the four shaft assemblies was estimated using 2013 Gearbox Reliability Collaborative data [15].
When performing a system FMEA, it is normal to break the system into its component parts or key assemblies in Life and cost headers from the FMEA. The first column heading is “Component,” which consists of assemblies, sub-assemblies, and components. The “Component” group related to the Gearbox is grouped into four shaft assembly categories. Also included in these shaft assemblies are the potential effects of gearbox housing deflection and deformation.
Some failure modes show a large value from the mitigation of TTEs, while other failure modes show a lesser value in Modes of failure and potential improvements from an RTD. Important items to extract from this data, presented in the next issue, will come the modes of high value are the failure modes that would benefit most from mitigation, and the total amount of incremental savings from all individual improvements shows the total value to the system from mitigation due to an RTD device installation.

The headers are from the FMEA analysis that will be presented in detail in the next issue. The modes of failure and potential life improvements come from adding an RTD device to the drivetrain.
FMEA inputs
This section on inputs to the FMEA is divided into gearbox and non-gearbox components. The ways in which TTEs may impact a gearbox are relatively well documented and there is high confidence in these links. The impact of TTEs on other components in the wind turbine is less well documented and is an area that would benefit from more research, along with review of available data.
Evaluating the impact of TTEs on the gearbox
Providing quantitative input to the gearbox-FMEA model called for an understanding of the relationships between loading on the wind-turbine gearbox and the failure modes of its bearing and gears. In particular, the necessary understanding is of how TTEs affect bearing and gear failure modes and their longevity.
To perform the FMEA, the failure-mode information was organized around its causes for each mode. This differs from textbooks and standards that discuss bearing and gear-failure analysis, which are organized around the failure modes alone. This situation necessitated systematically reviewing and analyzing every bearing and gear failure mode described in the established standards and failure analysis books, looking for potential links between causal factors, such as TTEs, and the many failure modes. Where there were clear references to causes attributable to TTEs, confidence in the link is considered high. Failure modes that were not in any way attributable to TTEs were grouped together under the Other Failure Modes and given a zero for creditability of evidence. The results of this research and analysis were summarized and populated in the FMEA model.
Two quite different but related sources of bearing and gear failure mode data were reviewed and analyzed for causal relationships between TTEs and failure modes:
- Bearing and gear-failure standards and failure analysis books [7, 8, 9], including ISO 15243 [12] and AGMA 1010 [5] and 6006 [4].
- Wind Turbine gearbox technical articles, research papers, presentations, and dissertations pertaining to the causes and effects of failure [2,3,15].
Axial cracking is not included in the established standards or failure-analysis references, and there are numerous competing explanations for the failure mode and its solutions. A simple criteria was used to narrow the field of explanations, based on the fact that axial cracking in wind-turbine gearbox bearings did not surface until turbines reached a threshold of about 1.5 MW. Therefore, hypotheses unable to explain this threshold were eliminated. This left only two plausible root-cause hypotheses:
- The through-hardened steel used throughout wind-turbine gearboxes has poor resistance to the formation and propagation of cracks. That is, it lacks sufficient toughness (crack resistance) for the specific application [7, 18].
- When bearing surface speed reaches a threshold under high-load events, the allowable shear rate of the bearing material is exceeded, leaving behind an initiation point for axial cracking, which then propagates under normal operation and accelerates by high-amplitude transient loading [11].
Some gearbox-failure modes were not included in the FMEA model for one of three reasons:
- The mode does not affect wind turbine gearboxes. The mode could be electric current erosion (fluting) and lightning damage, contact corrosion, or cavitation,
- The modes were not initiated or propagated by TTEs, and
- The modes were low-cycle fatigue failures which occurred within this first 10k cycles.
Although gearbox and generator failure is normal and expected – and are budgeted items in the wind business – in this FMEA they are considered chronic problems. Typically, there is much greater value in reducing chronic failures than unexpected, costly, sporadic events [13, 14, 15]. The FMEA model includes chronic and acute failures.
The next challenge was to find a way to combine data from the different failure classification systems used in the failure mode standards and failure analysis references. For simplicity, the numerous individual failure modes were sorted into three broad classes: fatigue, wear, and overload.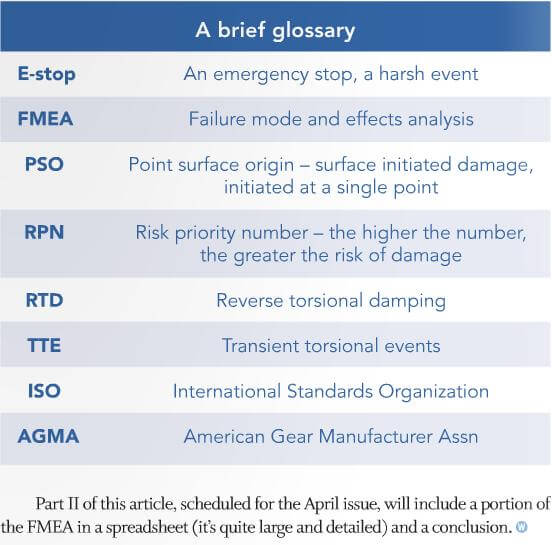
Fatigue is defined by ISO 15243, the international standard for bearing failure modes, as: “The change in the structure, which is caused by the repeated stresses developed in the contacts between the rolling elements and the raceways…Fatigue is manifested visibly as a flaking of particles from the surface.” AGMA 1010-F14, the recently updated version of the gear failure mode standard, notes that fatigue involves the initiation and growth of cracks and defines high-cycle fatigue as “…fatigue where the cyclic stress is below the yield strength of the material and the number of cycles to failure is high.” Wind-turbine gearboxes are not prone to low-cycle fatigue, which occurs at 10k cycles or less, and requires that each cycle result in macroscopic plastic strain. Fatigue damage is permanent and cumulative and follows a logarithmic curve, so small increases in cyclical stress levels can lead to rapid decrease in fatigue life [17].
Wear is broadly defined as the progressive removal of surface material due to mechanical, chemical, or electrical action. Wear modes relevant to this FMEA are adhesion, abrasion, fretting, and false brinelling. Wear modes excluded from this FMEA include chemical corrosion, electrical erosion, and polishing. Although micropitting and macropitting also remove surface material progressively, fatigue and its effects are not included as forms of wear, and will be referred to here as “fatigue wear.”
Overload occurs when applied loads exceed the yield or ultimate strength of the material in the stressed area. It can range in size from small, localized debris dents to covering larger areas by true brinelling, caused by roller indentation into a raceway. Overloading often ends the useful life of a part by fracture. Fatigue cracking often precedes fracture by cracking through a significant portion of the material.
This FMEA divides the gear and bearing failure sequence into three distinct stages, and examines the contribution of TTEs to each failure stage: initiation, propagation, and failure.
Part II of this article, scheduled for the April issue and to be reposted here, will include a portion of the FMEA in a spreadsheet (it’s quite large and detailed) and a conclusion.
Propagation
Once a crack has been initiated, propagation can begin, driven by cyclic loading, one cause of which is transient torsional events. Fatigue, hence crack growth, is the dominant failure mode in wind-turbine gearboxes. The crack may have been initiated by fatigue, a flaw, or from other pre-existing damage such as debris denting [9] or scuffing [6]. TTEs are strongly linked to fatigue failure modes in standards and failure analysis texts. TTEs accelerate crack growth because it is a function of loading [7]. Crack-growth rates tend to increase over time and the remaining material available to support loads becomes diminished, increasing the stress levels in the remaining material.
Steels that lack fracture toughness have lower fatigue lives than tougher materials. Through-hardened bearings, widely used in turbine gearboxes, have low-fracture toughness, which increases the risk of fatigue failure. Without propagation, initiation will not cause failure, so reducing loading will slow and sometimes stop propagation, thereby extending gearbox life.
Failure
This is the third and final stage in the sequence (initiation, propagation, and failure). A clear definition of failure is required for an accurate FMEA. In this analysis, a gearbox or gearbox component is said to have failed when it meets one or more of the following conditions:
1. Fracture has occurred on one or more parts. Common examples are inner rings with through-cracks and broken-off gear teeth.
2. The wind turbine cannot operate until the gearbox has been repaired or replaced.
3. Functional failures. For example, the turbine must be de-rated to operate with a particular gearbox condition, such as overheating or high gearbox vibration at rated power. In the FMEA, functional failure means the asset operates but does not function at a level of performance acceptable to the owner or user [14].
4. The severity of a failure mode is rated as high or severe in a standard or standards-based failure analysis reference.
5. Component failure means repairs can occur up-tower.
6. Gearbox failure means removal of the gearbox from the tower for repair or rebuild.
7. Catastrophic failure means the gearbox cannot economically undergo repairs or a rebuild.
The through-hardened bearings have low crack resistance [7], so suppressing TTEs should extend useful bearing life and reduce the risk of axial cracking. Cyclical loading drives fatigue, but the relationship is not linear. Halving peak-to-peak amplitude of drivetrain torque transients reduces their fatigue loading by about 75% [17, 19], so it is worth pursuing the life-extending potential of RTD devices.
Fatigue is the dominant failure mode in gearboxes linked to TTEs. Other modes include scuffing and plastic deformation. Fatigue exploits a wide variety of flaws, defects, and prior damage to initiate failure, which is the first of three distinct stages of failure. Initiation is followed by propagation and, finally, failure. Initiation takes the longest of the three stages, propagation is more rapid, and final failure can occur in an instant. The length of time in the initiation and growth stages of fatigue failure modes — ranging from gear tooth bending fatigue to the Hertzian fatigue of bearing elements — is influenced by heavy cyclical loading such as that resulting from TTEs. Analysis of gearbox failure-mode causes and effects suggest that suppressing TTEs has a high potential to prolong the initiation and propagation stages of failure in new, in-service, and previously damaged drivetrains.
Evaluating the impact of TTE on non-gearbox drive components
The dynamics of a wind turbine and the consequences of uncontrolled torque reversals on a drivetrain have the potential to create problems on the drive system beyond the gearbox. Some problems may have materialized within the past 10 years of wind-turbine deployments, while others may still exist that can cause failure before the target design life.
To address this topic, the authors reviewed literature along with a sampling of loads documents. A dynamic loads model (FAST) was run for a sub-MW turbine, some load time histories were reviewed, and best judgment was used to draw together initial suggestions to determine which components might be impacted by TTEs. A summary of components likely to have fatigue lives enhanced by use of an RTD device was developed, but in most cases the data was not sufficient for consensus, especially in comparison with other likely causes of failure modes. So, it was decided to leave the benefits as To Be Determined (TBD).
A more complete way of quantifying the benefit is a combination of instrumented wind turbines and use of the latest system models. Also, different configurations of turbines, with different tower heights, rotor diameters, and control strategies may have different design drivers. The trend toward taller towers and larger rotors will likely make the mitigation of drivetrain TTEs more important than it was in older designs.
Cutting-edge system models, such as SAMCEF and the RomaxWIND drivetrain model embedded within BLADED, capture details of a drivetrain integrated into the dynamic and flexible operating environment of a wind turbine. They’ve helped explain what goes on during harsh braking events [2, 3], but such models are not perfect [3]. Ideally, such models will one day provide a comparison of a more commercially relevant wind turbine under various conditions, with and without the benefit of an RTD device in the drivetrain. This kind of analysis (despite acknowledged shortcomings in terms of ability to capture internal deflections and accurately calculate the effect of transients), would broaden understanding of the benefits beyond the current main shaft torque measurements and adoption of Reverse Torsional Damping.
In the context of this paper, TTEs arise primarily from hard-stop protocols, but have also come from normal shut-down stops and may arise out of rarer fault conditions on a turbine — such as when one of the blades gets stuck between fine pitch and full feather in stormy weather, or even from rare wind-driven turbulence events. Hard stops are usually initiated when a turbine is at high risk, say during an over-speed initiated by a loss of generator load when the controller is not available or is being bypassed for some reason.
Typically, these hard stops come from a rapid pitch of blades to feather or stall with a simultaneous caliper-brake application. The severity of such an event is closely related to the operating point of the turbine. Worst-case loads normally occur near the rated wind speeds, when thrust loads are maximized on a pitch-regulate turbine. In this scenario, the rotor is fully loaded and the tower top is bent downwind by thrust forces. In a hard stop, the tower is suddenly offloaded and typically pulled forward by the negative thrust arising from the pitching blades, before the shaft comes to rest under the influence of the reduced aerodynamic input and the high-speed shaft brake. Real-world recordings have shown the worst torsional loads in the drive system tend to occur during hard stops in high gusty winds, close to cutout speed.
The analysis suggest the following components benefit from lower torque and stresses transmitted through a drivetrain equipped with and RTD:
Rotor blades and related connections
An RTD device has demonstrated, through torque measurements on the low-speed shaft, to reduce shaft torsional oscillations during shutdowns.
Because these torsional oscillations are attributed to the drivetrain vibration, with significant participation of the blades, it is concluded that the blades will benefit from additional damping. When the shutdown sequence begins, blades are roughly “flat” to the wind and the edge-wise direction of a blade should benefit most. But as the blades pitch, the reduction in vibrations will move toward a reduction in flap-wise bending. Along with blades, their connection to the hub will likely have a positive effect because the joint probably has a low-design margin related to fatigue.
Main shaft to rotor hub bolts
While it is not known if TTEs have a significant effect on the bolted connection between the main shaft and the rotor hub, it is thought that large oscillatory motion and resulting forces could potentially contribute to bolt loosening. In this case, mitigation of TTEs could be beneficial.
Main-shaft bearings
This FMEA assumes a three-point gearbox suspension with a locating spherical roller main bearing that supports all the rotor’s axial thrust and most of its radial force. Hence, it is intended to take the bulk of the rotor’s non-rotational loads so they do not transmit to the gearbox. The degree to which the main bearing protects a gearbox is a function of the drivetrain configuration: whether a three or four-point suspension, or other configuration. Regardless of configuration, it is believed the main bearing must react significantly to oscillatory side forces during a stop, especially a hard stop. As such, the main bearing will benefit from an RTD device that extracts energy from the torsional vibration and reduces the amplitude of these oscillations. In addition to a reduction in high-cycle fatigue of the bearing elements and fretting of the bearing to bedplate interface, a significant reduction is expected in sudden bearing skewing resulting from torque reversals.
Load reversals are known to damage the drive-system bearings. Such reversals are often more damaging when bearings are not rotating. The potential for surface damage is further exacerbated when stationary bearings are subject to simultaneous axial forces and rapid axial motion. Large conventional spherical-roller bearings have a high internal clearance in the axial direction. This limits axial motion and allows a line-contact impact between rollers and raceways. This can happen at the end of an aero and caliper-braking hard stop, when the main bearing is restraining axial load reversals from the high fore and aft oscillations of the tower, and simultaneously with radial-load reversals from the side-to-side tower oscillations.
High-speed shaft coupling
The high-speed shaft coupling accommodates small deflections and misalignments. It should withstand bedplate deflections and relative movement between the generator and gearbox arising from a hard stop, and still live with rotational fatigue. Nevertheless, significant misalignment will shorten coupling life, so it is postulated that a reduction in amplitude of large oscillations will have a positive benefit on fatigue life. Some turbines have documented issues of premature coupling failures [15].
Generator bearings and rotor windings
Bearings at both ends of a generator “experience high oscillations when the brake is applied due to the flexibility in the coupling and the proximity of the bearings to the brake disc.” [3] An RTD device between the brake disk and the generator is expected to remove energy from the worst of these oscillations, inferred from the time histories of the 1.6MW and 1.65-MW turbines presented in Part I. It’s also hypothesized that the reduction in oscillatory forces acting on the elements of the generator rotor will help extend its life.
Electronics and electrical systems
Thermal issues are considered the primary cause of premature failures in most electronic and electrical components. However, high vibration can also shorten life of components by loosening connections and breaking down insulation. Insulation deterioration can result in thermal failure. It’s suspected that an RTD device’s demonstrated ability to reduce more than 75% of the high-torsional oscillating energy in the drive system during hard stops may reduce the vibration excited in turbine substructures that support electrical components. A practical way to learn if this could result in financial benefit is to track failure rates and costs of turbines equipped with an RTD device, as compared to one without an RTD device.
Bedplate
“Large transient loads, such as those produced during an emergency stop, will apply large loads to the bedplate (mainly through the low-speed bearing supports and gearbox mountings) causing deflections that effect the whole drivetrain. Unpublished finite-element analysis (FEA) models indicated that these can cause significant deflection of the bedplate and nacelle structure, resulting in potential misalignment. This in turn can cause loads on the drivetrain bearings to significantly increase, most likely resulting in unacceptable damage accumulation” [3]. These deflections are more likely to impact welded bedplates that have a history of suffering from cracking of material, and may not have as much effect on more common cast designs.
Tower repairs, tower bolted connections, and anchor bolts
A review of design load time histories show that oscillatory loads, derived from gearbox torque arm reaction forces during stops, enter the tower and are visible all the way down to the foundation. These reactions manifest themselves, primarily, as rolling moments of higher frequency than the tower’s first natural frequency. The simulations available to support this paper show that occurrences of these oscillations correspond to the oscillation of the blades and drivetrain. Field measurements, however, show that in addition to the oscillations associated with the initiation of the shutdown procedure, torsional reversals occur as the brake activates and rotation stops. These oscillations are also reflected throughout the tower.
Given that the “rolling” oscillations entering the tower correspond to torsional variations on the low-speed shaft, which can be damped by an RTD device, it is clear that the tower system will also benefit from this damping. While the tower shell and flanges can likely accommodate higher loads than may arise from these oscillations, it is unclear whether or not there’s a meaningful impact on the bolted connections from transverse oscillations or resulting deflections. Dynamic modeling, with and without an RTD device, can help quantify the impact on overall tower fatigue and ultimate loads, but won’t get into the details of the bolted joints. FEA may help in analyzing potential benefits, but it is simpler to monitor bolt checks throughout towers (with and without an RTD device) to see if this results in a reduction of loosened bolts.
Results from the FMEA
Results of the FMEA show significant minimum potential savings for the gearbox when the turbine is installed with an RTD device. The gearbox is the focus of substantial industry research because there are many records of failures along with good understanding and documentation of the effects of torsion vibrations, TTEs, and overloads on bearings, gears, and gearboxes systems. The focus recently has been on the chronic axial cracking of high-speed inner rings and its relationship to loading and other factors.
The FMEA shows potential value for installing an RTD device. For instance, the high-speed assembly shows bearing axial inner ring subsurface fatigue, which includes axial cracking. The same failure mode shows up in the intermediate high-speed assembly, along with an additional four modes of gear failure. The low-speed intermediate assembly shows a few areas for potential moderate improvement related to bearing wear and overload modes. Finally, the low-speed assembly shows several significant potential savings through a combination of bearing and gear-fatigue failure mitigation opportunities. This is driven by the high cost of replacement or repair for these components and assembly systems.
There is one additional failure mode outside the gearbox identified by the FMEA. Bearing skewing and its resulting damage in the main-shaft bearings is shown to have a significant minimum potential cost savings. Due to insufficient information to show that an RTD device can have a significant impact on other non-gearbox components, there is a challenge in quantifying contribution and life impact in the absence of a dedicated set of loads, with and without an RTD device. Therefore, the potential benefit has been labeled as TBD. More work or reference material or both are required to bring the non-gearbox contribution to the same level as the gearboxes.
The table A few cost reductions provides a summary of the costs from significant failure modes by gearbox component. The minimum cost does not include crane costs, lost production, or labor reassignment costs. Furthermore, the values in the right-hand column show the most significant cost savings attributed to the mitigation of damage to a wind-turbine gearbox, using only a few of its major failure modes.
For the entire system, the table identifies which components gain most from the cost reductions benefit. The table also summarizes the failure modes highlighted in the table Simplified FMEA, non-critical modes removed. The greatest identified savings of installing an RTD device onto a wind turbine is demonstrated in the gearbox, so this paper focuses on that component, rather than on non-gearbox components. This data indicates that an RTD device would provide a significant minimum cost savings to the high and low-speed intermediate shaft assemblies, with some additional savings attributed to the high and low-speed shaft assemblies.
The results of the FMEA indicate that an RTD device may produce significant savings to justify installation after evaluating the gearbox alone. Combine that with potential savings from the main-shaft bearings and the RTD value increases further. Once a site has a statistically significant quantity of installed RTD devices it could present further value by tracking costs associated with non-gearbox components identified with TBD. Taking actual failure and cost data from a wind-turbine site further supports the FMEA as a valuable tool, and could show greater potential savings, depending on the frequency and type of failures at that site.
The FMEA model predicts that installing an RTD device could reduce annual gearbox costs by a minimum of 37%, not including crane costs, lost production, or labor reassignment costs. The FMEA further predicts that an annualized gearbox lifecycle cost of $23,750 could reduce to $8,800 with an RTD device installed. This represents a conservative one to two-year payback. Including the other drivetrain components and major turbine components, the FMEA forecasts an annualized lifecycle total turbine cost of over $47,000, but the potential savings from an RTD device is not fully estimated because of insufficient information on the effect of TTEs on most of these systems.
This analysis has some shortcomings due to the method for simplifying the failure data and frequency. Some scenarios, such as a complete gearbox replacement or rebuild, would affect the uninterrupted linear nature of the projected mean time between failures. This could “reset” the timing of the failure modes’ life with the installation of new bearings and gears. So, following a replacement or rebuild, the failure modes would be delayed, as compared to the linear method that this FMEA uses.
Regardless of the shortcomings, this simplified FMEA uses conservative assumptions to calculate costs and projected savings from the installation of an RTD device. It justifies the installation immediately after or during the repair or replacement of any major drivetrain component to maximize the extension of life by preventing damage.
Final thoughts
All wind turbines are subject to a variety of hard stops. Whether they use aero-braking only or combine aero-braking with caliper braking, these transient events can often produce undesirable torque reversals and significant torsional oscillations. RTD devices have proven their ability to reduce these kinds of undesirable transient loads during stops.
A review of the literature provides evidence that, in a gearbox, many premature failures in bearings, gears, and shafts can be attributed to TTEs. For non-gearbox elements, details of the impact of TTEs were not so readily available, but there is evidence and logical arguments can be made to support a conclusion that many of these components are adversely affected by TTEs.
The FMEA presented has made a conservatively framed case that the introduction of an RTD device into a wind-turbine drivetrain can mitigate risk and reduce the cost of operation, and shows a relatively brief one to two-year payback on gearbox savings alone. As more RTD devices are installed and accumulate more run time, the effects on failure modes, reliability, and cost saving benefits are expected to become clearer and estimates of benefits to non-gearbox components will be clarified.
Evidence collected during the deployment and monitoring of RTD devices is expected to help refine system models and provide designers with better tools to optimize future wind-turbine designs.
Recommendations
The data reviewed in this paper encourages site-wise retrofits, while the value per turbine might be even higher for those unit with an above-average number of hard or emergency stops per year. For many wind farms, the conservative one to two-year payback, in the gearbox cost savings alone, can justify fleet-wide installation of RTD devices. Other wind-farm owners may prefer retrofitting a statistically significant number of turbines and tracking the performance and reliability of those turbines, compared with a control set of other turbines. At the very least, wind-farm owners experiencing chronic problems with gearboxes or other major turbine components should look at installing an RTD device when those components are replaced or repaired.
For those wishing to do partial wind-farm retrofits, there are many early indicators that can demonstrate the ability of an RTD device to reduce loads and extend life. For turbine models that have not already demonstrated the load reduction capability of an RTD device, it’s recommended to record side-by-side torsional load graphs during hard stops, and on turbines with and without an RTD device. Examples of these graphs are presented in this article. Within a couple weeks, the recordings can provide valuable evidence of reductions in some of the worst turbine transient load events. However, the strongest benefit is a reduction in O&M costs and unscheduled downtime, with an associated increase in energy production within one year. 
Appendix
How an RTD device works
Real-world recordings of torsional loading in drive systems of many different turbine models show that the worst torsional vibrations and the worst torque reversals generally occur during transient events, such as emergency stops. Understanding how the major rotating masses (equivalent inertias) of a turbine drive system interact during TTEs is critical to understanding the damage they can cause and ways to mitigate it.
Inertia can be simply defined as the resistance to a change in speed. In machinery, with parts rotating at different speeds, it is useful to adjust the inertia values of components to a common speed. These are called equivalent, or relative, inertias because they help designers understand equivalent loads that various components can see in the drive system during changes in speed. In a wind turbine, the equivalent inertia of the blades, relative to the generator, is simply calculated using the gearbox ratio squared. A 100:1 gearbox ratio reduces the blade inertia by 10,000 to give its equivalent inertial effect relative to the generator inertia.
A typical turbine has 80 to 90% of its relative inertia in the rotor (blades and hub), with most of the rest of the inertia in the rotating parts of the generator. In normal operation, the rotor is driving the generator in the positive direction. Many events can trigger a stop command that results in the blades pitching rapidly to decelerate the turbine. During braking, the torsional loading in the drive is proportional to the inertias being decelerated. Most of the blade braking effort goes into decelerating the large inertia of the blades themselves, but 10 to 20% of the braking effort goes throughout the drive system to decelerate the generator inertia. See Figure 12, recorded at the main shaft during aero-braking only, on two 1.65-MW turbines; the blue line with an RTD device and the dashed red line without it. The oscillations induced by the excitation of the rotor natural frequencies are also seen on the high speed shaft coupling and, therefore, in the turbine with an RTD device. These large oscillations with peak negative values are sufficient to trigger the damping effect of an RTD device and limit the maximum torque reversals to about 40% of rated turbine torque.
In more critical Hard Stops, including many emergency stop protocols, caliper-braking is triggered simultaneously with the aero-braking. The caliper-braking effort is likewise divided with 80 to 90% of the torque going toward deceleration of the blade inertia. This causes a positive torque in the gearbox and the main shaft, large enough that the combined aero- and caliper-braking is seen as generally positive. See Figure 13, recorded at the main shafts on two 1.65-MW turbines, one with and one without an RTD device. Note that the turbine without an RTD device sees a large increase in torsional oscillations from Figure 12 to Figure 13, while the RTD-equipped turbine does not. This shows how effectively the damping action limits the torsional energy that can be stored in the drive system.
The RTD device in these demonstrations uses frictional damping set to slip when the reverse torque exceeds 40% of the rated torque of the turbine.
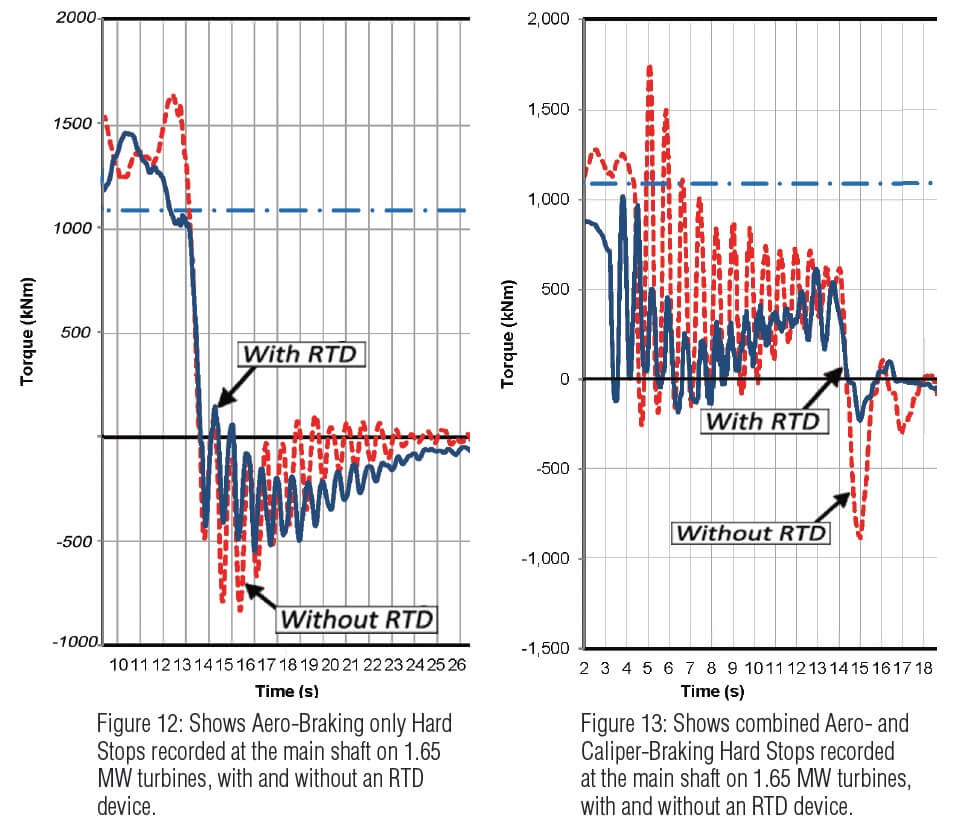
Figure 12 demonstrates how effectively it works to limit reversals to about 40%, but the torsional recordings on the main shaft in Figure 13 do not indicate a torque reversal exceeding 40% until after the turbine main shaft stopped rotating. What triggered the torsional damping during deceleration and how could the RTD device affect the torque reversal after the system is stopped?
To answer these questions, it is important to emphasize that the RTD device is mounted on the generator shaft where, during combined aero- and caliper-braking Hard Stops, the torsional behavior is very different than that of the main shaft recordings. The relative inertia of the generator on the 1.65-MW turbine is nearly 15% of the turbine total, so about 15% of the caliper-braking effort goes to decelerating the generator inertia, and is seen as a negative torque in the coupling and generator shaft. This is in addition to the negative aero-braking, shown in the dashed red line of Figure 12.

The torque at the generator shaft is simulated in Figure 14 with a dotted green line by adding 15% of the caliper-brake torque to the aero-brake-only graph of Figure 12, then increasing the torsional oscillations’ amplitudes in proportion to the increase excited by the caliper-braking seen in Figure 13. Thus, when the caliper-braking begins, the RTD device on the generator shaft will experience significant torque reversals in excess of negative 40% of rated torque and will cause frictional slippage and damping to occur. The frictional energy absorption is enough to reduce the high torsional oscillations’ amplitudes seen in the gearbox, main shaft, and blades by 50 to 70%, as shown in Figure 13. Vibrational energy is proportional to the square of the amplitude, so the 50 to 70% reduction results in a 75 to 90% reduction in torsional elastic energy in the system [16]. A similar reduction in torsional oscillations and reversals is seen when an RTD device is added to other turbine models, such as the 1.6-MW turbine shown in the first illustration, Rapid braking hard stop transient event.
There have been no studies on what a 75 to 90% reduction in torsional oscillation energy would do to benefit turbine reliability, but it is believed that many drive system and non-drive components would see an increase in mean time between failures.
An example is shown in Figure 13. The torsional damping action during deceleration nearly eliminates the torque reversals when rotation stops. The frictional damping is so effectively limiting the elastic torsional energy that can be stored in the drive system that it minimizes its release as a torque reversal, when rotation stops. This is expected to greatly benefit gearbox bearings and gears, and main bearings, all of which can see simultaneous high radial and axial loading with axial displacement. As this occurs after rotation ceases, even greater damage may occur than torque reversals which occur during operation or deceleration. Sliding motion under high loads on non-rotating bearings can initiate significant surface damage.
Torsional behavior at the generator with an RTD device
Figure 14 simulates a combined aero- and caliper-braking Hard Stop at the generator without an RTD device. What does the torsional behavior look like at the generator when an RTD device is added? Figure 12 shows that the torque reversals during aerobraking- only are limited to 40% of turbine torque throughout the drive system, including at the generator shaft. The frictional damping is limiting the maximum torsional elastic energy that can be stored in the drivetrain.
It is believed that during Hard Stops, the recorded torsional behavior shown as a blue line in Figure 12 could be overlaid onto the torsional simulation of Figure 14 to provide a realistic view of a more than 50% reduction in torsional oscillations and reversals at the generator shaft, seen in Figure 15. It is believed this could directly benefit generator bearing and winding life, and high speed coupling life. The reaction loads in the generator support structure would likewise be reduced, improving shaft alignment during some of the worst TTEs, further benefiting coupling and generator bearing life.
Real-world concerns
While a detailed discussion of all the known “real-world” factors affecting the longevity of wind turbines is beyond the scope of this paper, a few key areas of concern that affect the reliability of wind turbine components are briefly covered in this section. These are mentioned because, in some cases, they can be exacerbated by loads associated with TTEs and have associated failures delayed by mitigation of TTEs.
As turbines have grown, some components, such as the blades, have become even more susceptible to the introduction of manufacturing flaws. Flaws are also introduced through transportation, handling, installation, and O&M activities. For example, as stated, “large blades are likely to use the heaviest (thickest) possible reinforcing fabrics to achieve manufacturing efficiency” [1] and these “thick composite laminates have an increased likelihood of hidden flaws and multiple flaws being grouped in the same local area. A number of production related flaws may occur in larger structures which are more easily avoided in smaller structures….” [1] In particular, achieving consistent bondline quality during blade manufacturing becomes more difficult with size. O&M activities also introduce flaws through human error, as well as challenges in proactive flaw detection and timely repair.
It is believed that the interaction of flaws and/or shortfalls in design with system dynamics may, under certain circumstances, result in high amplitude fatigue effects. For example, the combination of gravity with aerodynamic forces can impose deflections on blade surfaces that can result in the peeling apart of adhesive joints and accelerated crack development, especially on longer blades. The addition of forces and excitation of resonances, induced by abrupt rotor stops, are expected to exacerbate this failure mechanism. In addition to blade-related issues, fretting of bolted surfaces and loosening of connections are believed to be possible when a turbine experiences large amplitude oscillating loads. Any methods that can mitigate the magnitude and frequency of occurrence of such oscillations should have a positive impact on the need for maintenance and repair caused by such interactions.
Finally, it is worthy of note that Root Cause Analysis (RCA) references describe how multiple issues often exist in parallel and only need an additional error or flaw to connect all the weaknesses together to create a failure. TTEs are an undesirable part of the operating environment of wind turbines. In some cases, a clear path to connect TTEs to high profile component failures can be shown, while in others their role has yet to be proven conclusively. Regardless, it is clear that TTEs are undesirable and it is likely that mitigation of undesirable loads can provide valuable insurance against all the possible issues that can line up in a complex “realworld” environment to reduce wind turbine reliability.
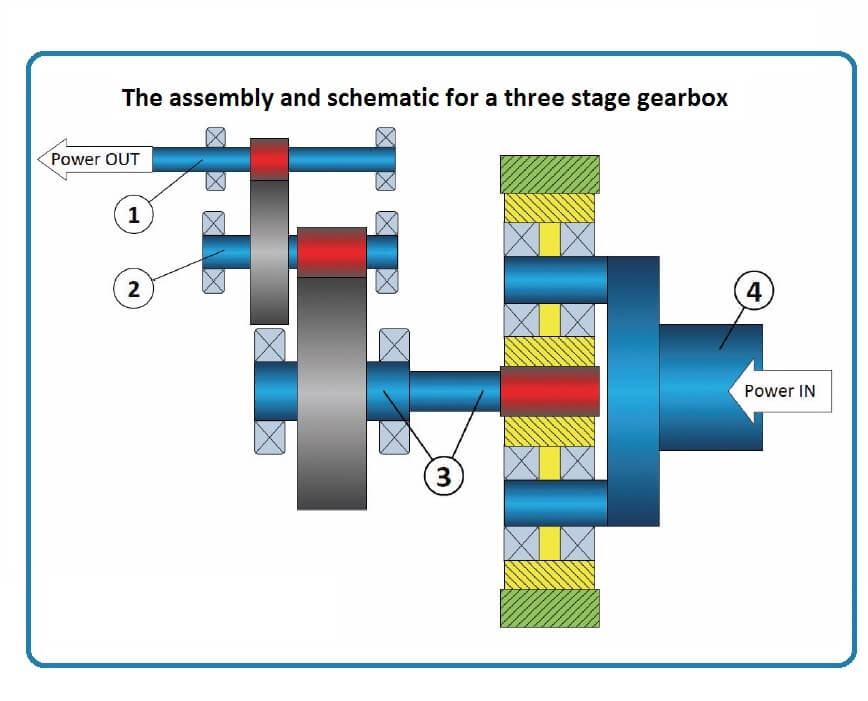
Figure 16
Gearbox assembly set definitions
- Gearbox High Speed Shaft Assembly (HSS) – Includes the high speed pinion shaft and high speed bearings. See Figure 16, Item 1.
- Gearbox High Speed Intermediate Shaft Assembly (HSIS) – Includes the high speed intermediate pinion driven by the bull gear; the high speed intermediate gear which drives the high speed pinion; and the high speed intermediate bearings. See Figure 16, Item 2.
- Gearbox Low Speed Intermediate Shaft Assembly (LSIS) – Includes the low speed intermediate gear, commonly called the bull gear. The bull gear drives the high speed intermediate pinion; the internally-splined hollow shaft; the low speed intermediate pinion, which is typically called the sun pinion; the sun shaft, with pinion teeth on one end and external spline on the other, which the spline is crowned to allow the sun to “float” between the 3 planets and the splined end mates with the internal spline in the low speed intermediate shaft; and the low speed intermediate bearings. See Figure 16, Item 3.
- Gearbox Low Speed Shaft Assembly (LSS) – Includes the low speed planet carrier which connects rigidly to the main shaft via a hollow shaft and shrink disc connection, along with a number of other connections. These other connections include the low speed planet carrier bearings, low speed planet shafts, low speed planet gears, low speed ring gear, and the planetary shaft bearings. See Figure 16, Item 4.
FMEA Header Definitions
- “Expected Useful Turbine Life (yrs)” is the basis for the useful life of the turbine, in years. While demonstration of a minimum life of 20 years is a requirement of the certification process, it is understood that many developers assume a 25-year useful life for their wind farms. This value ultimately drives the total cost, as the mean time between failures/ repairs is divided into this number to determine the total number of failures/ repairs the turbine will see over the useful life of the turbine. It can also be used to determine the total value of installing an RTD device over the life of the turbine. These costs and value over the turbine life is, however, not used in the FMEA, but would be useful when evaluating return on investment of purchase of an RTD device. Also, the analysis does not account for early decommissioning. That is, if there is a component failure at year 24 of 25 years, especially a catastrophic failure, an operator might choose to decommission the turbine earlier rather than spend the money for the repair. Such refinements are beyond the scope of this exercise, and are assumed to be of secondary importance, but could be relatively easily integrated into a more refined cost benefit analysis.
- “Projected Mean Time Between Failures / Repairs (yrs)” tells the story of the frequency of failure. Due to the wide range between infant mortality (ignored in this FMEA) and perhaps no failures occurring before a turbine becomes decommissioned, and as most modern turbines in the 1.5-2MW range have not yet been in operation long enough to record a full set of failure modes over a 20-30 year life, this value is a projected mean number. It is an estimate to determine how many repairs would be made over the useful life of the turbine. The frequency of replacements and repairs could be refined through the use of Weibull analysis, etc., but it is thought that the use of a linear failure rate is a reasonable starting point given the difficulty of obtaining Weibull parameters and the difficulty in projecting what might happen many years into the future.
- “Total External Cost To Restore Component Function” is a range that establishes the cost of the repair, with a focus on external cost, excluding the internal support staff, crane costs, and downtime. This is typically a fairly well-known and understood cost by operators, as it is the amount listed on the payment to purchase the parts or service to repair or replace the failed components. Experience-based estimates were frequently used for populating the FMEA.
- “Total Internal Cost To Restore Component Function” is one of the “soft costs” associated with a component repair or replacement, meaning it is often unknown, under-considered, or written-off as it is already included in the overhead cost of the site. It is a calculation of the average labor cost for internal maintenance staff, internal engineering, and support staff multiplied by the number of hours of work that the repair or replacement would take.
- “Mean Crane Cost” is the cost associated with the crane rental, upkeep and maintenance, or amortized purchase of crane equipment. Some components may have failure modes that are repairable up-tower without a crane, so some repairs may not need a crane. There may also be a great deal of variance on rental costs from site to site, so this is a projected mean crane cost. This is another “soft cost”, which may be well tracked at a turbine site per incidence, or might be tracked as a total for the year. Due to the variance of crane usage, this number is accounted for in the maximum calculated cost, but not included in the minimum calculated cost.
- “Estimated Downtime” is a “soft cost” which accounts for downtime associated with lack of production of the turbine due to failure. Values of components for this may fluctuate greatly, depending on the failure type and components. For instance, getting a gearbox rebuilt offsite would have more downtime than onsite repair or replacement. Also, downtime during non-peak season would not have the same effect as downtime during peak wind-generation. A site might wait to do repairs if they occurred off-season, but might respond quickly if a failure occurs at the beginning of a peak wind season.
- “Estimated Cost of Downtime” is the total “soft cost” of wind turbine downtime, based on the product of the following assumptions: estimated downtime, estimated average PPA rate of 5 cents/kW-hr, 35% capacity factor, 1500kW turbine. This value would vary based on site statistics and specific turbine model, but is a reasonable set of inputs to show the effects of downtime. This value is added into the maximum calculated cost, but not included in the minimum calculated cost.
- “Failure Modes That Can be Mitigated by a Reduction in Transient Torque Events (TTEs)” defines failure modes, by component. These are divided up for the gearbox components per commonly identified failure modes available in literature, and for the other drivetrain and other turbine components in simplified groups or specific modes, as the data is available. Much more detailed information is available for gearboxes than other components. See the FMEA Inputs section for understanding and definition of the individual failure modes. One row for each column is attributed to “Failure Modes not attributable to TTEs”, which is a group holding location for all failure modes other than those listed above. This method is valuable for ensuring that all the failure modes for components are accounted for, but will carry zero weight. Examples of failures in this row include damage from lightning strikes, improper maintenance, lubrication failures, static discharge, etc.
- “Calculated Range of Annualized Cost for Repairs or Replacements” is the total annualized cost affiliated with the turbine, based on the specific component, using the input and failure rates shown on the input columns. The maximum value includes the highest external costs and includes all the “soft costs” already defined. The minimum value excludes crane costs and downtime and uses at the minimum external cost. The Maximum Calculated Cost = Max External Cost + (Internal Support x Average Labor Cost) + Crane Cost + Estimated Cost of Downtime) / Projected Mean Time Between Failures. This is the baseline estimate of what failures in wind turbines are truly costing operators. If a turbine fleet being operated for a short number of years hasn’t seen any costs in repairs or replacements of a particular component, such as a generator bearing, but then had a replacement at year ten, this shows the cost associated with this ten-year failure, distributed equally throughout each prior year. There is value in that this shows the potential future cost of repair or replacement of a component that may have a problem, but hasn’t yet manifested into chronic failure. It is likely that turbine operations and maintenance costs will increase as wind turbines’ ages within a fleet increase.
- “Projected Life Improvement for an RTD Device in Mitigating TTE Damage” is the mitigation portion of the FMEA. This section helps define the effect from an RTD device to turbine component life, therefore defines how it reduces the operations and maintenance costs associated with each failure mode. It includes three inputs and one output.
• “Credibility of Evidence that Links TTEs to Failure Mode” is a weight-factored input which accounts for evidence in the field, studies, calculations, and simulations, which may indicate a link of TTEs to that failure mode. Using this weight-factored value allows a well-supported mode to carry nearly full weight, but a partially-supported link to carry partial weight, and a simple theory without background to only carry a fraction of its weight which indicates only some possible benefit, but high uncertainty. This rating is a guide, as follows:
0% – No plausible theory links TTEs to this failure mode.
10% – Plausible theory, but no credible support.
20% – Plausible theory and agreement from at least one other credible source.
30% – Good theory, plus modeling support, from at least one credible source.
40% – Good theory, plus modeling, testing, or field data, from at least two credible sources.
50% – Strong theory, plus modeling, testing, or field data, from multiple credible sources.
60% – Accepted theory, plus modeling, testing, or field data, from multiple credible sources.
70% – Some consensus and good evidence from multiple independent credible sources.
80% – General consensus that TTEs are attributable to this failure mode.
90% – Some statistical evidence that an RTD device has reduced the effects from this failure mode and damage.
99% – Well-accepted statistical proof that an RTD device has reduced the effects from this failure mode and damage.
- “Contribution Towards Failure” is another weight-factored input that accounts for how frequently this particular failure mode occurs to the component, as a percentage. The first step was to determine the percentage of failure modes not attributable to TTEs for each component, and then determine the distribution for the remaining failures through the modes. All the contribution numbers for each component must add up to 100%, ensuring that there weren’t modes of failure for each component that were overlooked.
- “Estimated Life Extension” is the best estimate for the percentage extension of life of that failure mode, due to the results of mitigation of damage from the install of an RTD device. 100% represents a doubling of life. These values were based on rough calculations of the reduction in peak loads, analysis and simulations, and best estimates from the authors and data in the public domain.
- “Estimated New Time Between Failures” is the output, which is the product of the mean time between failures, the credibility of evidence, the contribution towards failure, and the estimated life extension. This value shows incremental improvements of each failure mode due to the mitigation of TTEs from an RTD device. This extension of life is later used to calculate the projected annual cost reductions attributable to an RTD device.
- “Projected Range of Annualized Cost Reductions Attributed to the Addition of an RTD Device” shows the value to each component in having an RTD device installed.
Wind turbine design standards
IEC61400-1 Edition 3 (2005) is the current standard that new wind turbine designs must conform to in order to be certified, a key requirement for financing. As such, it is sometimes referred to as a “de facto” design guideline. That said, most manufacturers are understood to utilize it as a minimum requirement in the development of system loads against which physical components are designed. IEC61400-1 Edition 3 is the third edition of a line of standards that were used in a key step towards the development of a commercial wind turbine. As suggested by the name, it has undergone several revisions and, while it is the most current version, Edition 4 is already well along a path towards replacing it. These revisions have incorporated lessons learned, and have filled any obvious omissions that became apparent since the prior issue. As with many standards, however, it is a consensus document that cannot please everyone. A list of the editions and some comments on aspects of their evolution and implications for the operation wind turbine fleet are summarized below:
- Edition 1 (1994) did not include fatigue accumulated during stops, starts, and idling in the design fatigue spectrum. However, in relation to the total number of deployed turbines, those certified under Edition 1 are relatively few and many are getting close to the end of their design life.
- Edition 2 (1999) includes requirements for fatigue accumulation due to normal stops, starts, and idling. However, it is believed that the more aggressive stopping events, such as emergency stops and controller fault conditions were not formally required to be included in the system fatigue spectrum. Given that the majority of turbines currently in operation were designed to Edition 2 and have many years of operation ahead of them, it follows that a significant percentage of operating turbines carry a risk of problems arising from limitations to the events that were incorporated in the fatigue spectrum.
- Edition 3 (2005) requires that “all relevant load cases with a reasonable probability of occurrence shall be considered.” This is a step forward, but it falls short of requiring inclusion of all load cases that can be experienced at demanding sites. The load cases to be considered include faulting under various wind and temperature conditions, extreme loading events, transportation, install, and maintenance.
- Edition 4 (not yet issued) is designed to further narrow the gap between actual and calculated loading by adding more specificity to the scenarios used to calculate cumulative fatigue.
The key takeaway, of a very brief overview of the complicated subject of Design Standards, is that there appears to be a growing consensus that more and more of the events that occur during a typical operational year need to be included in the design basis to ensure the design life is achieved. There is some strong field evidence backing this up: gearbox borescope inspections provide clear evidence that transient torque events, especially reversals, cause severe adhesion (scuffing) of roller ends and bearing flanges (ribs), followed by abrasive cutting wear. Baker and Eatherton explore numerous examples of the damage mode and explains why it is believed to occur [6].
Furthermore, turbines designed under Edition 2, believed to represent the bulk of turbines currently in operation, may not have fully accounted for some of the more aggressive braking events that they may have to endure. The frequency of occurrence of these more aggressive braking events is dependent on a number of factors including the peculiarities of the environment within their sites and their specific locations, relative to each other and the local topography. As a consequence, the actual fatigue life of the design-driving components of a wind turbine may not be what was expected. This is more likely at locations where the site-suitability analysis showed turbines did not have significant fatigue margins (the difference between fatigue loads calculated using the IEC design envelope and the fatigue loads calculated under site-specific conditions was small).
The significance of these observations regarding certification loads used for the design of wind turbine hardware can be best understood by considering the impact of the “real-world” on a wind turbine. While the IEC standards attempt to account for such “real-world” issues through safety factors and a broad spectrum of load cases, general knowledge and awareness of field failures suggests that some key interactions may be missed. Whether these “misses” come from an oversimplification of the atmosphere, lack of inclusion of important load cases, lack of fidelity in models, or challenges associated with modeling complex dynamics, such as impacts during transient effects, remain to be determined. Strathclyde University appears to have made some important strides in this direction [3], and it is hoped that others will build on this work.
Another key takeaway of a very brief overview of the complicated subject of Design Standards is that there appears to be a growing consensus that more and more of the events that occur during a typical operational year need to be included in the design basis to ensure the design life is achieved.
For further reading:
1. Cairns, D et al, Wind Turbine Composite Blade Manufacturing: The Need for Understanding Defect Origins, Prevalence,
Implications and Reliability, Sandia Report SAND2011-1094, Feb 2011.
2. Heege, A, et al, Fatigue Load Computation of Wind Turbine Gearboxes by Coupled Structural, Mechanism and Aerodynamic Analysis, DEWI Magazine No. 28, February 2006.
3. Scott, K., et al, Effects of Extreme and Transient Loads on Wind Turbine Drive Trains, 50th AIAA Aerospace Sciences Meeting, Nashville, TN, Jan 10-12, 2012. 4. American Gear Manufacturers Association, Standard for Design and Specification of Gearboxes for Wind Turbines, ANSI/AGMA/AWEA 6006-A03, 2003.
4. American Gear Manufacturers Association, Standard for Design and Specification of Gearboxes for Wind Turbines,
ANSI/AGMA/AWEA 6006-A03, 2003.
5. American Gear Manufacturers Association, Appearance of Gear Teeth – Terminology Wear and Failure, ANSI/AGMA 1010-F14, 2014.
6. Baker, P. and Eatherton, S., Adhesive and abrasive Wear of Roller Ends and Ribs in Wind Turbine Gearbox Bearings, Gearbox
Reliability Collaborative, 2014.
7. Errichello, R. L., Gear & Bearing Failure Analysis, Geartech, 2011.
8. Errichello, R. L., Morphology of Micropitting, American Gear Manufacturers Association, 2011.
9. Errichello, R. L., Hewette, C., Eckert, R., Point-Surface-Origin, PSO, Macropitting Caused by Geometric Stress Concentration, American Gear Manufacturers Association, 2010.
10. Houser, Donald R., Gear Mesh Misalignment, Gear Solutions Magazine, 2013.
11. Hyde, Scott R, PhD., White Etching Areas – Importance of Microstructural Characterization and Modeling, Timken Co., 2014.
12. International Organization for Standardization, Rolling bearings – Damage and failure – Terms, characteristics and causes, ISO 15243, 2004.
13. Latino, Robert J. and Kenneth C., Root Cause Analysis, Third Edition, CRC Press, 2006
14. Moubray, John, Reliability-centered Maintenance, second edition, Industrial Press, 1997.
15. Sheng, Shuangwen, Report on Wind Turbine Subsystem Reliability – A survey of Various Databases, National Renewable Energy Laboratory, 2013.
16. Kelly, S. Graham. “Mechanical Vibrations: Theory and Applications.” CL Engineering, 2011.
17. Jackson, Kevin. NREL Technology Exchange Workshop, October 1993.
18. Errichello, Budny and Eckert, Investigations of Bearing Failures Associated with White Etching Areas (irWEAs) in Wind Turbine Gearboxes, STLE, Detroit, May 2013.
19. Meyer, Haydn, Schuller et al, Very High Cycle Fatigue Properties of Bainitic High Carbon-Chromium Steel, International Journal of Fatigue, September 2008.
Filed Under: News, O&M


