By Kevin Wolf / President / Wind Harvest International
Wind farms in California and other regions of the world exist only in relatively small geographic regions.1 Most of these resource areas have reached their physical or political2 limits in their ability to install additional propeller-type, horizontal axis wind turbines (HAWTs).3 Nonetheless, many have topographies that create excellent near-ground wind speeds.
To profit from the energetic wind below their HAWTs, wind farm owners need cost-effective vertical axis wind turbines (VAWTs) that operate efficiently in high turbulence and that do so without wake4 from the added rotors negatively impacting their existing turbines. They also need turbines that are wildlife friendly.
Near-ground turbulence
The good-to-excellent average annual wind speeds (6 to 9 m/s, 14 to 20 mph) found at 10 to 25-m above ground level in wind farms in California5 and other regions are well known to wind industry meteorologists.6 Passes and ridgelines accelerate near-ground wind and cause wind shears to decrease, often significantly. Meteorological data also document that thermal and obstacle-induced turbulence in the high-energy, near-ground wind is found in many wind farms, including in four of California’s five Wind Resource Areas.
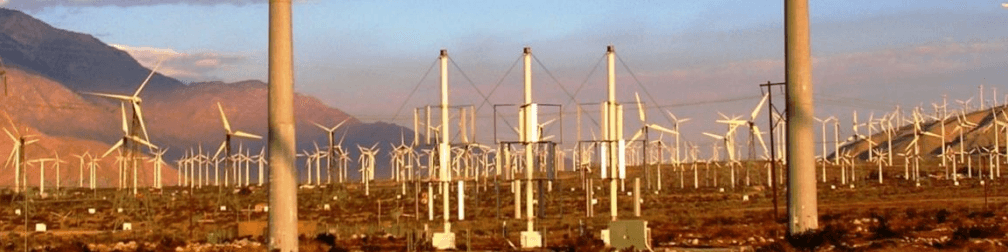
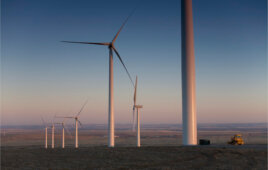
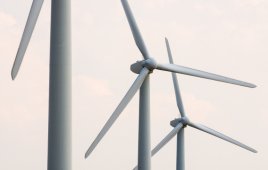
Three Windstar 530G VAWTs among HAWTs in the San Gorgonio Wind Resource Area, California
One reason near-ground wind resources haven’t been developed is that HAWTs have increased failure rates when their blades pass through turbulence.7 As a result, rows of HAWTs are hundreds of meters downwind of each other, and the bottom tips of their blades range between 20m and 50m above ground level.
HAWT turbulence-loading problems arise primarily from their long blades connecting to the drive shaft at only one end and their large rotor having to operate in changing wind speed and direction. The blades and bearings used in modern HAWTs would have to be substantially strengthened to withstand the high peak and cyclic loads from the near-ground layer of extreme turbulence.8
Why VAWTs now
VAWTs are intrinsically less sensitive to turbulence than HAWTs because their blades are attached to the rotating shaft at two or more locations. Another beneficial outcome of their geometry is that VAWTs don’t have to yaw and turn into the changing wind direction.
At least one such wind turbine (i.e., Wind Harvest International’s (WHI) Harvester VAWTs[ix]) is ready for certification and operation underneath HAWT10 Other turbines could also soon be capable of achieving a 20+ year service life in high turbulence and be ready for industry-scale sales(e.g., Stanford/Dabiri’s VAWTs), once they can comply with the IEC 61400 certification process and become UL listed.
Historically, VAWTs have had trouble with mechanical design and durability because they lacked field-validated, aeroelastic modeling that HAWT engineers use. That has been resolved by building on VAWT modeling developed by Sandia National Labs and advanced at Delft and Danish Technical University. The engineers of the WHI Harvester used a suite of a prototype-validated finite element, frequency response, and fatigue analysis models that together function as an aeroelastic model.11
Aerodynamic modeling funded by a 2010 California Energy Commission (CEC) EISG grant[xii] to WHI proved that modern VAWTs, when placed close together would also create the “coupled vortex effect”. The one-meter close spacing and counter rotations let them produce 20 to 30% more energy per pair than from two VAWTs operating separately. This offsets the problem VAWTs face that HAWTs don’t: Their blades create drag as they return into the wind. Historically, this increase in drag prevented them from realizing more than a 45% efficiency,[xiii] whereas HAWTs can achieve 50%. With the coupled vortex effect, VAWTs in arrays can theoretically realize the efficiencies of HAWTs.
Another problem hindering VAWT development is that smaller VAWTs like WHI’s Harvesters use more steel and material per rotor-swept area and MW of installed capacity than do large HAWTs. However, with large-scale use possible in wind farms:
- The mass manufacture of the smaller VAWTs offers significant savings.20
- Their shorter towers use less material 21 and smaller and easier to build foundations.
- They make dual use of valuable land and infrastructure 22 when installed in existing wind farms.
An additional benefit modern inverter-based VAWTs have for repowering wind farms is that they can help solve the grid harmonics and reactive power problems that are caused by older HAWTs using “induction generators”. A megawatt of VAWTs like the WHI Harvester 70 with inverters similar to the ones in Northern Power Systems’ 100kW HAWTs can, independently of wind speed instantaneously source or sink 450 KVARs 23 of the problematic reactive power produced by the older HAWTs. Solving the reactive-power problems of older wind farms can increase their power quality and real output.
VAWT impacts on HAWTs
Aerodynamics predict that the wake from VAWTs won’t harm HAWTs, and may, in fact, help them. The wake and vortices shed from an array of tightly spaced VAWTs should stay in the same wind layer that passes through their vertically spinning rotors. Modeling shows that downwind by five rotor heights24 or ~eight rotor diameters 25 , the wake of VAWTs is gone, their vortices have disintegrated, and the wind speed has recharged, in part due to the vertical mixing that their spun-off vortices create.

The graphic shows a vertical and horizontal staggering of VAWTs upwind and downwind of a 2-MW HAWT. The distances between VAWTs and their heights are described in Table 1 with the exception that the Harvester 70 VAWT distance immediately upwind of the HAWT is 100m and not 70m. The faster-moving wind that is upwind and above the HAWT will be drawn down toward the ground by the vertical mixing and energy extraction of the VAWTs below.
VAWT placements are theorized to increase the wind speeds entering the rotors of the HAWTs above them in two major ways.
Lowering the wind shear
A growing body of field data and research, led in large part by Dr. John O. Dabiri, has demonstrated how counter-rotating VAWTs lowers wind shears by bringing higher, faster-moving wind toward the ground and replenish the
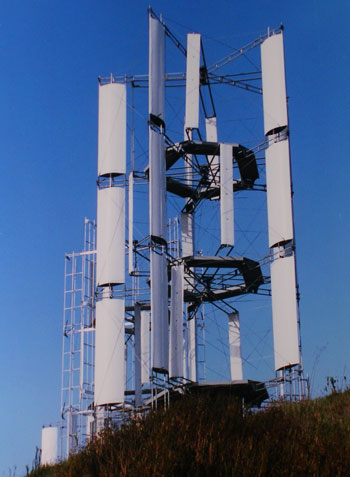
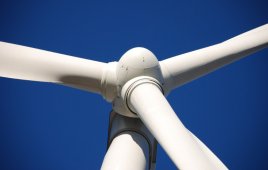
Vertical axis wind turbine such as this one from WHI could capture the sufficient wind that blows below a conventional wind farm of HAWTs.
wind speeds lost to the energy and turbulence the VAWTs produce.26 As a result, faster moving wind from above will drop down into HAWT rotors and increase their energy output.27
Stanford University doctoral candidate Anna Craig led a study that modeled various VAWT arrangements. Their results 28 indicate that VAWTs can interact positively when placed in close proximity to one another. Craig noted that “We think that the VAWTs can have blockage effects causing speedup around the turbines that help downstream turbines. They can also have vertical wind mixing in the turbine’s wake region, which assists in the wind velocity recovery.”
In Benefits of collocating vertical-axis and horizontal-axis wind turbines in large wind farms, the authors stated, “Because of the presence of the VAWT layer, the turbulence in the wind farm is increased, which enhances the wake recovery of the HAWT. The faster wake recovery more than compensates for the additional momentum loss in the wind because of increased effective surface roughness associated with the VAWTs.”
Porous wind fence effect
Dr. Marius Paraschivoiu’s modeling shows that there will be a few meters of high turbulence directly above an array of closely spaced VAWTs. Above that, there will be a zone where the wind speeds increase above ambient. This is caused by the blockage effect of the VAWTs.
A row of VAWTs could be placed upwind of a HAWT at just the right height so that the HAWT blade enters a zone of higher wind speed with no significant increase in turbulence. Arrays of VAWTs placed a short distance downwind of a HAWT can also create a speed-up effect for the upwind HAWT, but the physics are different. The wind speeding up over the VAWTs decreases the pressure there, which increases the pressure difference between the front and back of the HAWT rotor. This, in turn, would increase the wind speed through the HAWT rotor and thus its energy output.
Just how much this porous wind fence effect could benefit HAWTs was to be a significant focus of the LiDAR studies WHI proposed as part of its R&D proposal to the CEC EPIC Program.
VAWTs potential to increase wind farm energy output
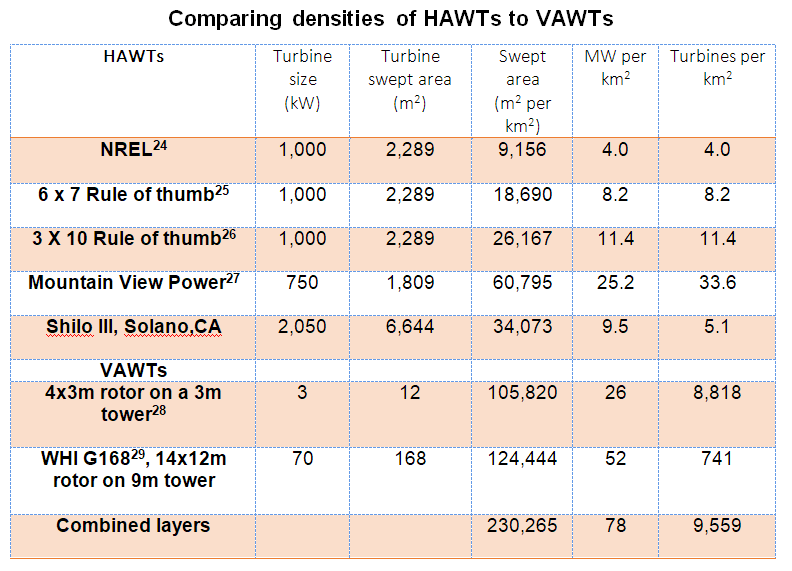
HAWTs in wind farms are placed substantial distances apart. Below is a table comparing land used in some wind farms in California’s Wind Resource Areas to other means of estimating the amount of land a HAWT wind farm needs.
Modeling and field testing show that the relative distances between rows/arrays of VAWTs can be much shorter than with rows of HAWTs without the downwind row losing wind speed and energy.23
The table below shows the VAWT energy densities that can be developed with the following assumptions:
• One-third meter between 3kW VAWTs in a four-turbine array
• One meter between G168 VAWTs in a four-turbine array
• Two rotor diameters (6m and 24m) between arrays in a row
• 5 times rotor height between G168 rows (70m)
• 8 times the rotor diameter between rows of 3-kW VAWTs (24m)
The layouts in illustrations would lead to about 150 to 200 MWs of VAWTS on the same land on which 32 MWs of HAWTs now operate in one of the best near-ground wind resources30 in the San Gorgonio Pass. Dabiri’s research on VAWTs predicts a 5 to 10 times increase in energy density is possible from VAWTs compared to HAWTs. This seems to be eminently doable with two layers of VAWTs set among the same MWs of HAWTs.
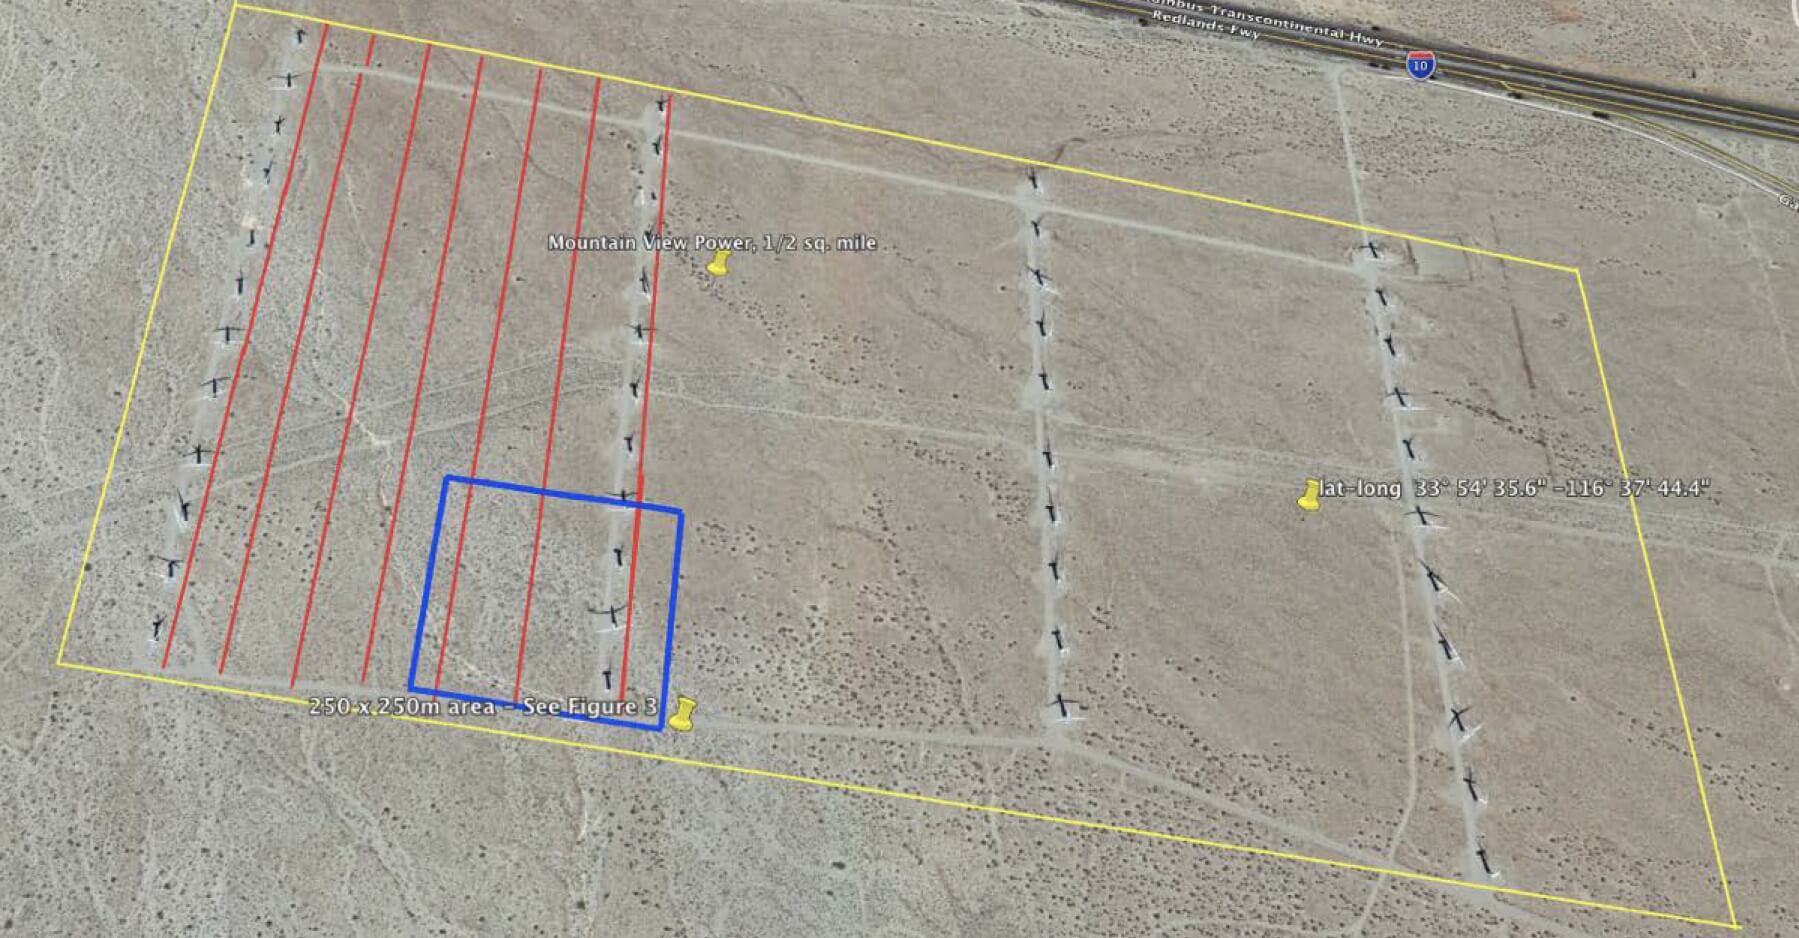
The Mountain View Power LLC wind farm at the junction of the Whitewater River and Interstate 10 (33° 54′ 35.6″ -116° 37′ 44.4″) in the San Gorgonio Pass has 44, 300-kW HAWTs (13 MWs) in the ½-square mile outlined in yellow. Rows of G168 VAWTs are envisioned along the red lines, each set roughly 70-m apart. The tan illustration below shows a turbine arrangement that would be placed in the blue square in the above photo. Pick on the photo for a larger version.
In the Mountain View Power wind farm, the wind is unidirectional from the west. In the illustration below:
• A row of small VAWTs (3 kW) maximizes the porous wind fence effect increasing the wind speed into the taller G168 VAWTs a few meters downwind.
• The G168s are a short distance (10 to 25m) downwind of a HAWT such that the bottom blade tips of the HAWT pass at just the right height above the VAWTs to safely maximize pressure difference the downwind VAWTs create.
• More rows and arrays of small- and medium-sized VAWTs are placed upwind and downwind at roughly a 7-rotor diameter distance apart.
Next steps to adding VAWT layers to wind farms
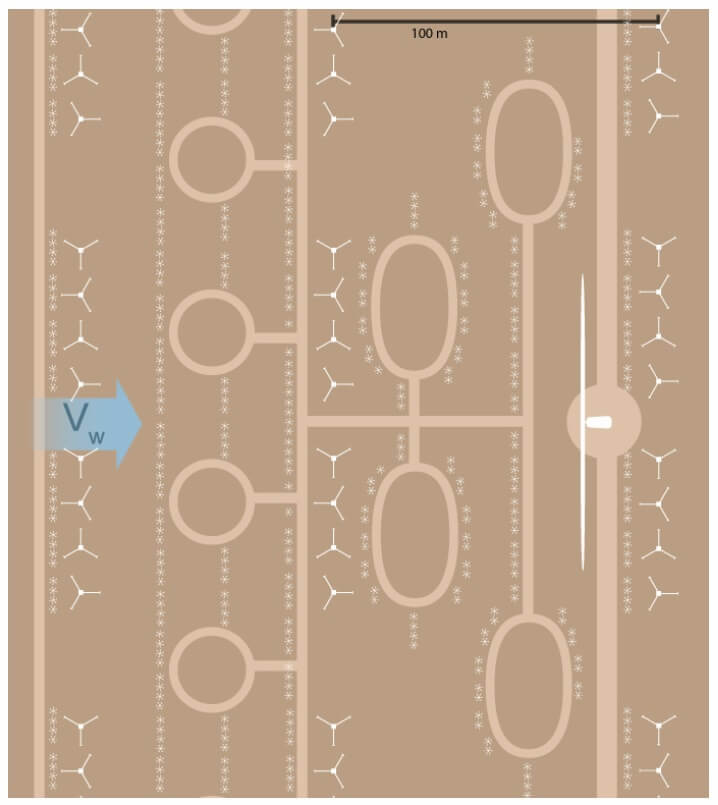
This 250 X 250 sq. meter slice of the San Gorgonio Farm in Figure 1 shows one way in which VAWTs of different heights could be placed around a newly installed 2-MW HAWT on a 65-m tower. In this graphical representation, there are 428 of the 3-kW VAWTs and 39 of the WHI’s 70-kW VAWTs and one 2-MW HAWT.
In the last round of wind energy grants through the CEC’s EPIC Program, there were three applications to advance the development of VAWTs for installation in existing wind farms. All three were either disqualified or failed to score enough points. Some of the main objections from reviewers included the following misunderstandings:
• Near-ground wind resources won’t be developed because wind shear causes the wind speed to be too low to ever be competitive with simply adding new wind farms of HAWTs.31 (Note: High wind shear occurs in wind farms in the Great Plains but not in California or other areas with passes and ridgelines).
• VAWTs have such a terrible history of commercialization that grants should not be made for their development until after they have been certified.32 (Note: Grants should be available to help renewable energy technology get through the most difficult part of the commercialization process – certification.)
• Funding should not be spent on how VAWTs can best be sited in a wind farm because R&D on HAWT placement is already commercialized.33 (Note: Little is known about how VAWT wakes will interact with HAWT wakes in different topographies and wind conditions.)
WHI’s proposal to the EPIC Program called for the use of its G168 VAWTs in a 140 to 280 kW project on ranch land in the Solano Wind Resource Area. There, San Jose State University LiDAR and its transportable meteorological mast with sonic anemometers would have been used to collect wake data from the VAWT array. Modeling would have been done with the help of Stanford University’s Large Eddy Simulation CFD model. WHI committed to placing the resulting data into the public domain, so other universities and companies could begin to validate their own modeling codes for VAWT wakes.
More field data on arrays of VAWTs is needed. LiDAR is the key to measuring the changes in wind speeds and turbulence created from different ways of linking together co-and counter-rotating VAWTs. Then data will be needed on how those VAWT wakes interact with HAWT wakes. Given the capabilities of modern wake and topography modeling, it shouldn’t take long to confirm basic “rules of thumb” for how vertical turbines can be safely and effectively installed along ridgelines and among the wind turbines in rich resource areas like the flat desert lands of the San Gorgonio Pass.
Wildlife
VAWTs will eventually enter the wind farm market. Before large numbers are installed, their potential impact on birds and bats needs to be evaluated and mitigated through the California Environmental Quality Act (CEQA) and other land use planning processes. Both Dabiri’s and WHI’s most recent EPIC proposals included new ways of documenting how birds and bats react to VAWTs. Biologists34 theorize that these animals evolved to fly around three-dimensional objects, such as trees and VAWTs, and will have an easier time avoiding their blades than they do those of two-dimensional HAWTs. Producing field data to try to disprove this hypothesis is a fundamental first step.
The fastest way to produce the data would be for all 100+kW VAWT projects like the one WHI is pursuing to use 24/7 motion detection and recording systems with binocular, high-definition cameras. Such tools can be field validated and then relied upon to capture far more animal-turbine interactions than traditional field observation methods. In-field, mortality studies should accompany the camera data analysis to compare the two methodologies until the mortality studies are no longer needed to accurately count fatal interactions.
Given the potential for VAWTs to be safely installed in valuable wind resource lands containing endangered species’ habitat, grant funding of VAWT wildlife research would be a wise investment.
Benefits to ratepayers and slowing climate change
Installing thousands of megawatts of new VAWT capacity in existing wind farms with good near-ground wind resources promises to be of significant help to ratepayers and local economies, especially if some of the VAWT components can be manufactured near the new installations.
Layering VAWTs among HAWTs in high-value wind resources should result in a lower Levelized Cost of Energy than any other renewable energy option. With 40% Capacity Factors and a 14% “learning curve” for price reductions in the technology, by 2025, the LCOE of VAWTs installed among HAWTs should drop to $.05 per kWh, which is less than the wind energy alternatives for places like California, where it is very difficult to permit new wind farms, and the alternatives are expensive offshore projects or installing new transmission lines to new projects in places like Wyoming.
According to Project Drawdown, the second-best way to meet carbon reduction goals is with on-shore wind development. Making double use of existing wind farm infrastructure to harvest the lower wind layers of some of the best wind resources in a region should be a priority on the world’s roadmap for achieving its carbon and pollution-reduction goals while keeping ratepayer costs low.
Key research questions
1. Rows of VAWTs will enhance recovery of the mean wind speed above, but the turbulence fluctuations in the
wind layer above will likely increase significantly35.
• How far above and downwind of a field of VAWTs must HAWTs be so that the higher turbulence doesn’t harm the lifetime of the HAWTs’ blades and drive trains?
• How problematic is the turbulence created by different types and placement patterns of VAWTs?
• Does the shape of the VAWT blade tips matter to the turbulence that might impact HAWTs?
2. VAWTs and HAWTs layered in the densities of Figures 1, 2 and 3 could increase the 800 MWs of HAWTs in the San Gorgonio Wind Resource Area to more than 6,000 MWs and rotor-swept area by a similar percentage. Could this more intense extraction of energy and lowering of the boundary layer have either positive or negative impacts for regional and even distant weather patterns and intensities?
3. Families of species have similar attributes, behaviors, and physiologies. How much field research needs to done before scientists can accurately predict whether a species that has never seen a VAWT will be able to avoid being hit by its blades? For example, if research proved that vultures were able to consistently avoid arrays of VAWTs with carrion placed underneath, would studies still be needed on whether condors in Chile were always able to avoid VAWT blades before VAWTs were allowed in condor habitat in the U.S. where the bird is an endangered species?
The complete 12-page article in PDF format is available on the windharvest.com home page
Footnotes and further reading
1. In 2014, WHI conducted a cursory review of wind farms around the world to evaluate them for topographies and roughness that were conducive to creating good near-ground wind speeds. At that time, approximately 20 to 25% of wind farms had the topographies, wind shears and wind speeds that should produce 15-20 mph average annual wind speeds at 10-20m above ground level.

2.  The politics of zoning and permitting are influenced by concerns overviews, habitat, aviation and wildlife impacts. There are many peer-reviewed articles documenting this. Here is one that covers many of the issues - https://journal.gnest.org/sites/default/files/Submissions/932/932_published.pdf

3. The large setback requirements needed by rows of HAWTs are well documented. New HAWTs cannot be installed within most existing wind farms without reducing the wind speeds or increasing the turbulence realized by their neighbors.

4.  The rotating blades of wind turbines create wake and turbulence in the wind in a similar way that a boat and its propeller create wake and waves in the water. The wake created by VAWTs is very different from the wake created by HAWTs.  HAWTs with their blade tip speeds often exceeding 150 mph create circular wakes extending and mixing together long distances downwind.

5. Almost all the data used to produce the “Wind Atlas” published by the CEC in April 1985 was derived from reports written in part by some of the consultants below from 1980-1984 who collected and found near-ground wind data, most often at 30’ above ground level. For example, it shows seven sites in the Altamont Wind Resource Area have average annual wind speeds varying between 15.4 – 19.7 mph and averaging close to 17 mph at 30 ft above ground level (agl).  The Atlas also shows six sites in the Solano Wind Resource Area with wind speeds averaging ~15 to 18.5 mph at ~33 ft agl. One of the reasons for collecting near ground wind data in the 1970s and 1980s is shown on the inside back cover of 1983 CEC Report – Wind Energy, Investing in our Future. There is a photo of a DAF-Indal Darrieus-type VAWT with a hub height of around 30 ft agl.  At that time, VAWTs were expected to be major players in the future of wind energy production and data collection for potential wind farms was oriented to their hub heights.

6. The following wind industry meteorologists and companies will confirm that there are good to excellent average annual speeds and high turbulence in the near-ground wind in California’s Wind Resource Areas. Note that titles and associated organizations are used for identification purposes only:

Allen Becker, Consulting Meteorologist
John Bosche, President and Principal Engineer at ArcVera Renewables
Neil Kelley, Applied Meteorologist (retired)
Pep Moreno, CEO, Vortex
Ron Nierenberg, Consulting Meteorologist
Lucile Olszewski, General Manager, Ensemble Wind
Richard Simon, Consulting Meteorologist
John Wade, Senior Meteorologist, Ensemble Wind
ArcVera Renewables,  Wind Prospecting and Resource Assessment
WindSim,  CFD Wind Resource Assessment

7. Turbulence problems created in HAWT blades, gearboxes, and bearings HAWTs are documented in multiple places in this wind engineering textbook, “Wind Energy Explained: Theory, Design and Application,” J.F. Manwell,  J.G. McGowan, A.l. Rogers; John Wiley, U of Mass Amherst, 2002.

8. David Malcolm, PhD, structural engineer, retired from Det Norske Veritas/Gemanischer Lloyd

9. WHIHarvester VAWTs have ~170 square meters of rotor-swept area and 50 to 100 kW+ generators, which vary based on the wind resource. For specifications see: http://windharvest.com/harvester-vawt/

10. WHI’s Harvester 70 design files have been sent to the  Small Wind Certification Council, which follows the IEC 61400-2 certification requirements for small wind turbines under 100kW in size.

11. WHI used a Frequency Response and Fatigue Model first created and validated by Sandia National Labs on its Darrieus-type VAWTs. Using strain gauge data from the Harvester 70 prototype in Denmark, WHI validated the loads predicted in its Midas FEA model and these other two models.

12. “Modeling Blade Pitch and Solidity in Straight Bladed VAWTs”, Iopara Inc, Bob Thomas and Kevin Wolf, February 12,2012, Final Report to the California Energy Commission’s Energy Innovations Small Grant Program.

13. Sandia National Labs’ field research on a Darrieus-type VAWT showed it was capable of achieving a maximum of a 45% efficiency or Cp max. See “A Retrospective of VAWT Technology”, Herbert J. Sutherland, Dale E. Berg, and Thomas D. Ashwill, SANDIA REPORT (SAND2012-0304), January 2012 and “The Sandia Legacy VAWT Research Program.”

14.  “Land-use Requirements for Wind Turbines in the U.S.”,  Paul Denholm, Maureen Hand, Magdalena Jackson, and Sean Ong, NREL, August 2009.  Note that NREL’s study covers “Total Wind Plant Area” which is considered the “footprint of the project as a whole” and includes more land than the Rule of Thumb methods of determining land use per MW of wind turbines.

15.  Six rotor diameters between turbines in a row and 7 rotor diameters between rows.

16. Three rotor diameters between turbines in row and 10 rotor diameters between rows.

17. Satellite imagery of the 750kW NEG Micon turbines. Mountain View Power Partners LLC, Riverside County, California. Note that this specific location might not be appropriate without hydrological modeling for many more VAWTs because of their roughness impact on flood events from the Whitewater River.

18. Assumes four VAWTs in a 13-m long array with two rotor diameters between each 12kW array in a row.

19. The blade tips of and vortices shed from the VAWTs create turbulence, vertical mixing and roughness should bring faster-moving wind into the taller Harvester 70 arrays. An array of the 9m tall VAWTs only meters upwind of Harvester VAWTs on 8 to 10-m tall towers would create a blockage effect, and if positioned correctly send more into the VAWTs above and downwind. Together, the field of VAWTs could have a greater positive impact on the wind speed increases realized by the HAWTs.

20. WHI’s Harvester VAWTS are made of extruded, aircraft quality (6061-T6) aluminum. Bob Thomas, a founder of the Wind Harvest Company and the inventor and lead engineer of their Windstar turbines determined that a NACA 0018 blade profile to be effective and easy to extrude with internal walls.

21.   HAWT towers not only use more material because they are taller but they have to be strengthened further to handle the oscillations that come from their offset rotors. VAWT blades rotating evenly around the top of its tower (discussion with Herb Sutherland, retired Sandia National Laboratory engineer who worked on the mechanical aspects of wind turbines.

22.  For a full build-out of a wind farm’s understory, new transmission lines and substations will be needed.  For a “capacity factor enhancement” project where VAWTs are added to the wind farm but are turned off as the substation reaches capacity, no new transmission lines or substations are needed.

23.  “Reactive Power Compensation - Using a Northern Power® NPS 100TM or NPS 60TM wind turbine to manage power factor”, NPS Engineering Bulletin

24. In Dr. Marius Paraschiviou’s letter to the CEC in support of WHI’s grant application, he stated “…after the CEC Innovations grant was completed, we conducted additional aerodynamic modeling on downwind wakes that showed VAWTs like WHI’s Harvesters will be able to be placed about six  rotor heights downwind of an upwind VAWT array and realize the full wind speed that entered the rotors of the upwind array.”

25.  A number of Dr. John O. Dabiri’s papers show that VAWTs when placed as in their field studies can regenerate ~95% of the full wind speed at 7 rotor diameters downwind. (Kinzel M, Mulligan Q, Dabiri J., Energy exchange in an array of vertical-axis wind turbines. Journal of Turbulence 2012; 13: 1–13).  Note that in his field studies, Dabiri’s placement of VAWTs are as close together as they are in Paraschivoiu’s modeling.  The tighter spacing and the resulting increase in wind speed in the gaps between the VAWTs that were used in Paraschivoiu’s modeling probably is the reason for the difference

26. “Potential order-of-magnitude enhancement of wind farm power density via counter-rotating vertical-axis wind turbine arrays”. John O. Dabiri, Journal of Renewable and Sustainable Energy 3, 043104 (2011) and Benefits of Co-locating Vertical-Axis and Horizontal-Axis Wind Turbines in Large Wind Farms.

27.  The energy in the wind is the cube of the wind speed so a small increase in wind speed results in a significant increase in the energy available for the turbine to convert to electricity.

28.   “Low order physical models of vertical axis wind turbines”, Anna E. Craig1,a), John O. Dabiri2, and Jeffrey R. Koseff3, Journal of Renewable and Sustainable Energy, Feb. 2017

29 The blade tips of and vortices shed from the VAWTs create turbulence, vertical mixing and roughness should bring faster-moving wind into the taller G168 arrays. An array of the 9m tall VAWTs only meters upwind of G168 VAWTs on 8-10m tall towers would block the wind, and if positioned right send more into the VAWTs above. Together, the field of VAWTs could have a greater positive impact on the wind speed increases realized by the HAWTs.

30 WHI operated its Windstar 1066 and a Windstar 530 VAWTs in this section of the San Gorgonio Pass for years and recorded average annual wind speeds of 16 mph at 10m above ground level.

31 Jocelyn Brown Saracino, Wind Energy Manager with the US DOE in her critique of WHI’s grant proposal states, “(WHI’s) proposal suggests that VAWTs might be used as an understory below HAWTs and suggests that the primary driver for the height of HAWTs is that near-ground wind is too turbulent. Wind resource is much greater at height and this calls into question the resource potential for VAWTs deployed in this fashion.

32. In Jocelyn Brown Saracino’s comments onWHI’s CEC EPIC proposal, which were similar to her critique of Dabiri’s proposal, she stated “To date no VAWT has received certification in the US due to technical challenges associated with their performance (energy production on average lower than predicted and also due to issues associated with reliability and maintenance). I do not recommend providing funding for VAWT turbine installation until after certification has been obtained”

33. The Technical Review of WHI’s proposal disqualified it because “In the questions and answers for the solicitation, answer #30 states that “Projects focused mainly on siting or optimally locating wind turbine including wind pattern modeling, are outside of this solicitation.”

34.  The author has talked with numerous ornithologists who hypothesize that birds, especially many birds of prey, will see and avoid the shorter, vertically rotating turbines. Hawks, raptors, vultures and similar soaring and hunting birds have their eyes focused close to the earth, often in the 10m zone above the ground. Above that, they haven’t evolved the need to see the fast-moving, two dimensional HAWT blades. Because VAWTs have horizontal arms with wide fairings that attach to their vertically aligned blades and because they are close to the ground, these birds should easily see VAWTs as obstacles similar to trees but on which they cannot land because the “branches” are moving.

35. Communication with Dr. John Dabiri.
Filed Under: Repowering
The following comments came from Doug Selsam and have been edited for brevity:
Sorry Mr. Wolf, but after reading your article, I remain unconvinced of the value of vertical axis wind turbine or VAWTs. Let me explain why.
The shortcoming of the vertical axis design was made clear with personal experience. A neighbor bought and mounted an expensive version not far from here, a high-wind location in California. Sadly, I photographed its wreckage less than a year later. I think water skiing through rough water is similar to flying through turbulent air, so I imagine the poor blades which were beaten by hitting a constantly-reversing air at high speed.
Tower height is another issue. The article suggests “lower height” as an advantage. Why deploy at a lower height if the wind is found up higher? Vertical-axis turbines are almost never installed at a decent height because anyone bothering to put up a tower will not bother with a vertical-axis turbine. Try finding a vertical-axis machine on a tall tower. I know of none.
Another statement says blades attached at two points make them better able to withstand turbulence. Personal experience with the turbine in the first paragraph says otherwise. Blades on conventional or “propeller-type” turbines (horizontal axis wind turbines or HAWTs) are aligned with the main force involved, which is centrifugal force. So they do not need multiple mounting points and need not be as stiff. Also, “propeller-type” blades are a better use of material.
In addition, HAWTs outperform vertical-axis versions for similar reasons that boat propellers outperform paddle-wheels on old riverboats. Propellers are proven the best choice for kinetic-energy exchange in an open current flow, whether for propulsion or for energy capture.
The thrust forces on propeller-type blades are more constant than those experienced by vertical-axis blades because the blades always face the wind. A vertical-axis blade experiences reversing aerodynamic forces twice with every rotation, so the machines must be built ten times as strong as a regular turbine just to avoid ripping itself apart.
Unfortunately, VAWTs do destroy themselves, which is why you rarely see one operating in a wind farm, even though many had been installed in the 1980s.
The article further advocates placing vertical-axis turbines in wind farms where the geography funnels wind into a small area. But slowing the wind near the ground has the same effect as lowering all of the towers for the regular (productive) wind turbines, thereby reducing their output.
Wildlife is another concern. Many birds and bats spend most of their time near the ground. What evidence is that VAWTs are less hazardous to them than HAWTs?
We all want to see wind energy advance, and it is good that someone continues to at least research vertical-axis machines.
Mr. Wolf responds:
Thanks for your comments, Mr. Selsam. Let me address your concerns.
1. Near ground wind resources can be excellent in areas like all of the CA wind farms where topographies create a near ground, speed-up effect and low-to-negative wind shears. See references 5 and 6 in the article and speak with most any industry meteorologist with experience in California. You can also find data on how exceptional the 10m above ground level wind speed data is in CA’s Wind Resource Areas in the CEC 1985 Wind Atlas.
2. You are right that VAWTs will inherently use more material per rotor swept area than a HAWT. However, being able to use shorter towers to capture the excellent near ground wind resources and making double use of land and infrastructure should more than compensate for the cost difference of more rotor material. We don’t anticipate competing with tall HAWTs but there are no reasons why repowered wind farms with HAWTs and VAWTs shouldn’t be less expensive per MW installed and kWh produced than at a wind farm repowered by HAWTs alone.
3. Let’s not ignore the problems HAWT blades have with turbulence. Several references in my paper proved that HAWT blades cannot effectively operate in near ground turbulence and that is the first fundamental pushing HAWT blades to stay out of near-ground turbulence. Talk to HAWT manufacturers about problems their turbines have with turbulence. As a technically savy person, you should have faith in the ability of good engineering to solve problems such as turbulence over blades. Don’t be so pessimistic believing that VAWTs can never overcome the problem of operating well in turbulent winds.
4. Don’t ignore the coupled vortex effect (CVE) that occurs with two H-type VAWTs placed about 1-meter apart. Bernoulli’s Continuity Principle and the modeling done by Canada-based CFD consultants at IOPARA (www.iopara.ca) show the CVE to be solid.
5. Please present references that VAWTs must be made 10 times as strong as HAWTs to withstand the same wind forces. Our strain-gauge data doesn’t show that. VAWTs will take more material per rotor swept area, but not 10 times as much. From experience, the figure is closer to two and less depending on factors such as solidity, rotor swept area etc. Additional material costs are easily offset by shorter towers, and lower transportation, installation, and maintenance costs per installed MW.
6. The history of Sandia VAWTs tells that it only created field validated aeroelastic models (e.g. fatigue, frequency response) after they tested their 500kW Test Bed Darrieus type VAWT in the early 1990s. They never used what they learned on a new VAWT. The FloWind VAWTs were not designed using aeroelastic models. Modern VAWTs can now be engineered with validated models. You seem to be a person who would understand how problematic the lack of good models has been to getting VAWT designs to be as mechanically sound as HAWT designs.
7. The modeling done at CalTech and Stanford shows that rows of VAWTs would pull energy out of the wind but when the VAWTs are installed as counter-rotating pairs, the vortices they shed create vertical mixing that quickly recharges near ground wind speeds and brings faster moving wind closer to the ground.
8. If people believe that determined engineers can to overcome problems and companies want to exploit excellent renewable natural resources, they should also acknowledge that wind farms with 15 to 18+ mph average annual wind speeds in the layer of wind below HAWT rotors will one day result in a technology that will let them economically harvest that valuable resource. We think our VAWTs will be first to enter this market and a surge of competitors will follow because making the VAWTs is pretty straightforward with good modeling. No one is making more windy land in California, and existing wind-farm land increases in value with each passing year.
9. Regarding wildlife, we explained why VAWTs are likely to be friendly to wildlife (Animals evolved ability to better see 3D versus 2D objects). We say that VAWT developments should come with camera technology that can evaluate whether or not birds see and avoid the new turbines. If some species don’t, then developers should calculate into the project IRR, the lost energy that would occur when the VAWTs need to slow when problematic birds or bats are detected nearby.
10. Comparing small Lift-type VAWTs or any size Savonius turbine with large VAWTs like ours is an unfair comparison. Size matters as does the type of VAWT. The failures of small turbines or any past turbine model does not make it a given that all future VAWTs will fail. This is especially true when one considers the problems early VAWT manufacturers faced by engineering their turbines without field validated aeroelastic modeling based on near-exact prototypes.
I encourage you to read the paper again and all its footnotes. I’ll be glad to hear what you have to say.
Best regards,
Kevin Wolf, author of the paper