Philip Totaro / CEO / Totaro & Associates

Philip Totaro
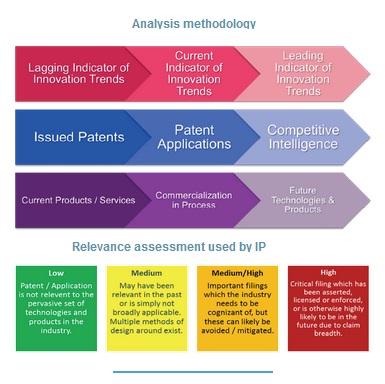
Companies seeking to differentiate their products and services often seek patents to secure the revenue streams generated by their innovations. The patents these companies obtain can serve as a proxy for their R&D expenditure, so the impact of thorough and comprehensive analysis of the patent landscape can be profound.
Multiple independent studies from the U.S. Patent & Trademark Office, the European Patent Office, and research companies in multiple industries have determined that anywhere from 70 to 95% of all relevant and independently verifiable information regarding the function of a particular technology comes from the patents and applications covering that technology.
 The remainder of such technology intelligence is comprised of other sources such as conference proceedings, technical papers, and journal publications. In order to get the complete picture, it is important to combine all relevant information sources when analyzing the evolution of technology and predicting future trends.
The relevance of a particular patented innovation to the industry can be measured by the degree to which that technology has been duplicated, so a relevance assessment determines the extent to which particular technologies have been copied. This assessment also serves to identify potential patent infringement risks and commercial liabilities in the form of royalties which might be owed by one company to a competitor who holds those patent rights.
Using this analysis method, IP Analyzer software lets users quickly visualize the component and technology trends which have emerged in the industry by comprehensively evaluating the patent landscape of over 40,000 global patent filings in the wind industry. While there are well over 100,000 patent filings on wind technology generally, IP Analyzer has been able to weed out the false positives and focus on the core set of innovations which are relevant to horizontal axis, utility-scale technology.
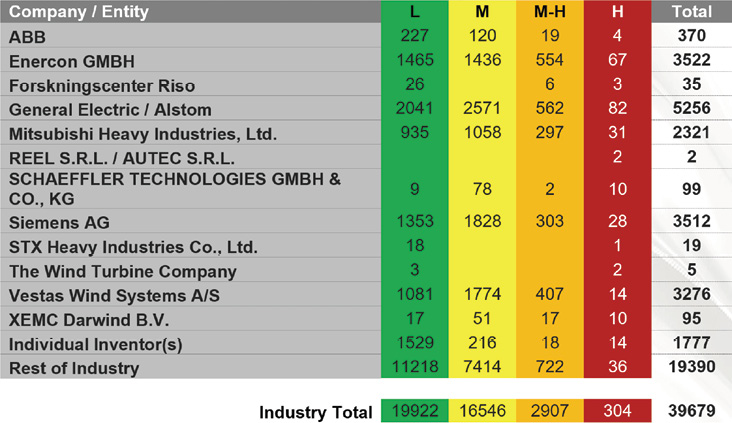
A heat map for the patent landscape
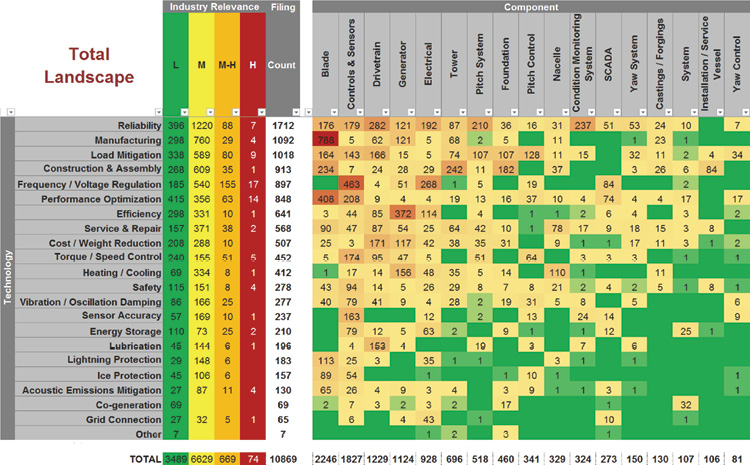
The heatmap indicates that blade manufacturing, controls for frequency and voltage regulation, aero performance, and generator efficiency have been some of the most heavily patented areas historically.
Heatmap for the patent landscape (above) shows the concentration of patent filings in a given component and technology cluster. It is clear that blade manufacturing, controls for frequency and voltage regulation, aero performance, and generator efficiency have been some of the most heavily patented areas. This correlates to the historical cost of energy reductions seen in the industry.
Ranking companies by the quality of their patents
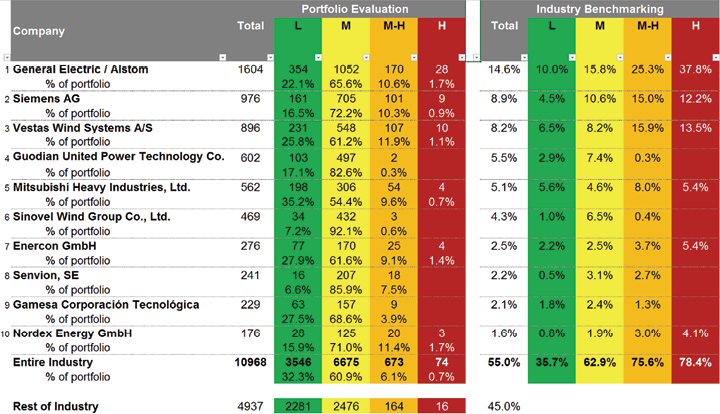
IP Analyzer also allows for industry and competitor benchmarking with an array of metrics delivered through information dashboards. Comparison of the innovation efforts of the top 10 IP holders in the industry reveals important trends. Over half of the patents on technologies developed and used in the industry are held by the top 10 companies, but they also control over 75% of the patents on widely used technologies identified by the orange and red coding. This increases the potential liability exposure for competitors to those in the top 10.
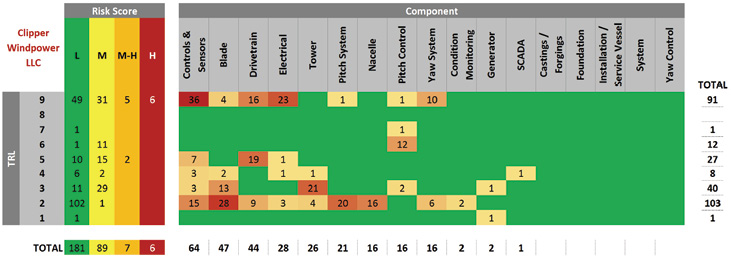
Technology maturity based assessment
 The software analyzes the total landscape to reveal industry and competitor benchmarking shown in easy-to-read charts. This provides comprehensive information and immediate visualization of important factors which differentiate one company’s technology capabilities from another. For example, in Ranking the companies by the quality of their patents, of the top 10, Chinese manufacturer Guodian United Power holds no high value patents (red column) but is still fourth in wind patent asset ownership.
Through tracking of a Technology Readiness Level, IP Analyzer determines the extent to which a competitor is using its own patented innovations. Many companies have cultivated a patent portfolio full of ideas they never intend to use, as well as many innovations which are impractical to use.
Technology benchmarking
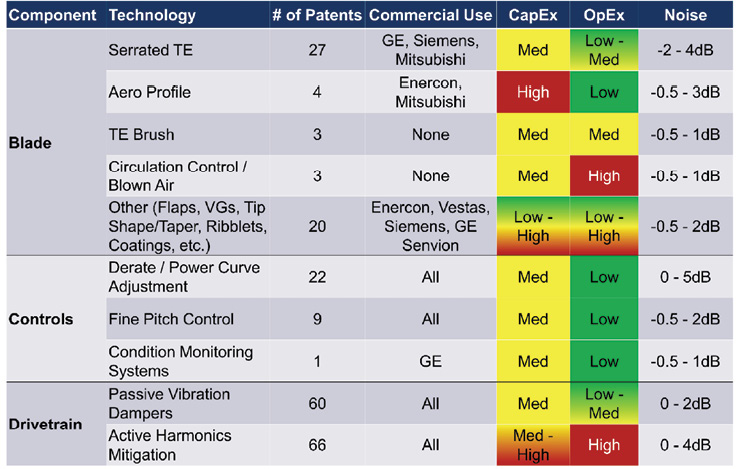
IP Analyzer can determine the extent to which the commercialization of a specific technology has taken place, what was the non-recurring engineering cost associated with technology development, as well as predict the CapEx, OpEx and performance benefit which the individual technology brings to bear.
Patents also serve to codify a commercial risk associated with the potential infringement of a competitor’s intellectual property rights. Having determined the usage of patent protected technologies from the relevance assessment, IP Analyzer also serves to inform a company about the commercial liability due to the design similarity of their product or service offering to the IP rights of their top competition.
Product claim map
A composite risk score identifies the extent to which a company might have to undertake risk mitigation such as in-license of IP rights or potentially change its design to avoid a competitor patent.
The composite risk score quantifies the extent to which a specific product architecture might have infringement risk exposure compared to the breadth of the patent claims for each one of the 40,000 plus patent filings worldwide.
IP Analyzer also shows a detailed breakdown of the potential patent liability exposure of a specific turbine design to each competitor based upon the relevance assessment. This identifies the extent to which risk mitigation might be required or royalties might have to be paid based upon the usage. Because the status of patents changes over time, as does the usage of those patented technologies by competing companies, IP Analyzer adjusts the composite risk score in real-time.
This process, conventionally known as product claim mapping, results in a total number of patents which might have infringement risk exposure for a specific product architecture. IP Analyzer also identifies the companies that hold those patent rights, which helps a product manager or risk manager identify potential hot spots.
This independent IP risk review, by IP Analyzer, is similar to the process of getting a type certificate on a wind turbine or sub-component. This IP risk evaluation and certification has already become part of the project finance due-diligence process. So far, IP Analyzer has been instrumental in cost avoidance totaling $210 million by mitigating IP risks which would have otherwise resulted in royalties. 
Filed Under: Featured