
Darrell Stovall
The U.S. has about 65 GW in its installed base of operating wind farms with a significant number of projects coming off warranty in 2014 and this year. It’s no surprise that quality O&M service has an impact on the bottom line of a project. And yet, there is no standardized systematic way to assess service providers. For such a metric, wind industry consulting firm DNV GL developed a benchmarking framework and devised a survey which was presented to eight independent service providers (ISPs). Darrell Stovall, principle engineer with the firm, presented the framework and survey results at the recent O&M Summit in Dallas.
Wind turbines are being serviced through a variety of organizations with a range of qualifications and skill levels. “Categorizing service providers can be challenging because turbine suppliers – the OEMs – and owner-operators also provide services. So, to a degree, the focus of my presentation is on ISPs, because they include essentially ‘pure’ service organizations and it’s the easiest group to get our arms around,” explained Stovall.
One approach to addressing industry needs is to have a standardized method that assesses service providers. The proposed solution is a Service Provider Qualification framework or benchmarking tool. “It’s a structured quantified approach that can assess wind turbine service and related functions, identify service gaps for OEMs, ISPs and/or owners-operators, and can be used as a continuous improvement tool. There are also potential competitive advantages to using this benchmarking framework,” said Stovall.
What’s more, he adds, this benchmark is not just a concept. “We have done capability assessments of Upwind Solutions and Duke Energy Renewable Services using the framework. DNV GL would like to thank those companies for their help in developing and refining this process. We’re also talking to OEMs and owner-operators about conducting further capability assessment studies. This is a service DNV GL offers, but we also see a need in the industry, so the comments today are presented on a non-commercial basis. They are intended to present this framework and see if there is interest in the industry. The approach can be used in many different applications. It’s a flexible tool.”
For instance, when an owner-operator is planning to self-perform maintenance, the framework would be a way to assess its strengths and weaknesses, and where it must focus. “If you’re an ISP and want to systematically evaluate your capabilities, it can be used to do that. The focus of the study and the level of effort can also be adjusted to meet the needs,” said Stovall.
As a basis for the benchmarking, DNV GL identified 10 key functional areas related to service. Attributes, requirements, and/or metrics have been defined for each of the 10 areas. “This is a systematic way of assessing and grading capabilities to put them in a high, mid, or low range category that can be aligned to a 1 to 10 rating. The ratings are typically presented in tabular form and in a spider graph.”
DNV GL has conducted these capabilities assessments in a straight-forward manner starting with a standardized Request for Information, or RFI. “We would review that information provided by a company – a service provider – then visit the home office, remote operations center, and service center. We would also interview key personnel in person and over the phone, including their customers, and visit several operating sites. The deliverable is a report that includes an assessment of each functional area, areas for improvement, and recommendations, as well as the tabular presentation and the spider graph results visualization,” said Stovall. A typical spider graph is included in and accompanying figure.
The 10 functional areas are:
- O&M services and general capabilities
- Availability and performance
- Parts, inventory, and supply chain
- Safety and quality program
- Primary support systems and functions
- Turbine platform experience and vendor relations
- Supplemental and enhanced service and products
- Engineering and technical support, and performance monitoring and improvement
- Home office and organization
- Financial resources
Stovall said there is some grouping necessary for a unified structure, “But we think we’ve covered the areas important to a service provider. We have also recently conducted a survey of ISPs and have rolled the survey results into the presentation starting with Functional Area #1: O&M services, general.”
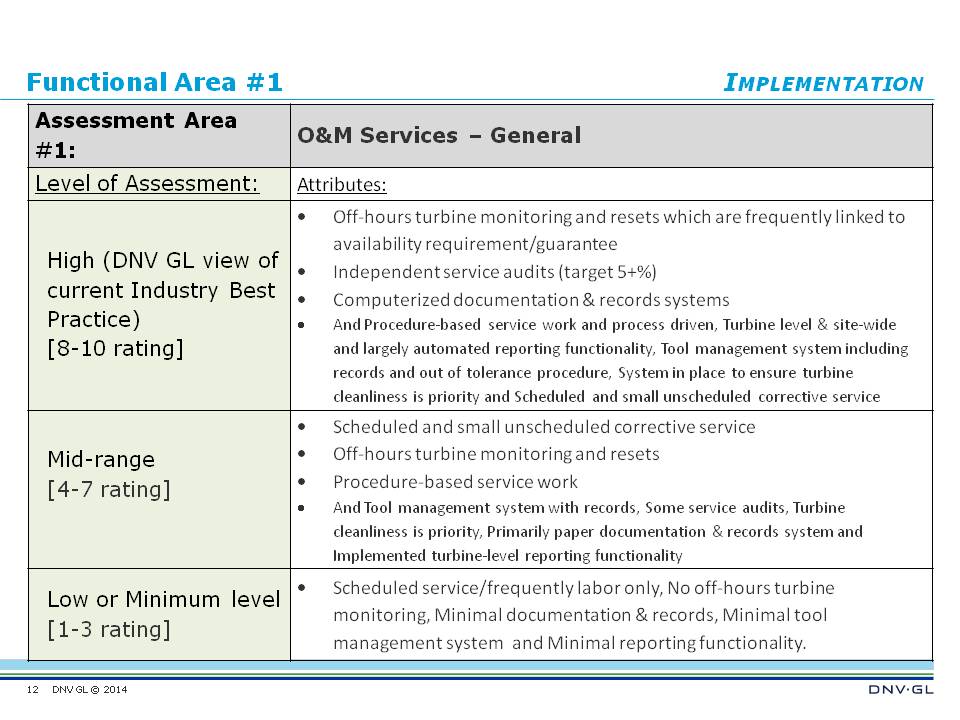
The accompanying table provides a closer look at the Functional Area #1 as an example of the detail examined. The high range is also DNV GL’s assessment of current Best Industry Practice. “In each grouping we’ve identified attributes. Based on survey results on Functional Area #1 [general O&M services], most of the eight participants put themselves in the high range. I think most ISPs are trying to provide a full range of general on-site services. The low range is basically scheduled service, typically labor only.” The survey results for this functional are shown in an accompanying graph.
The ranges are additive in that the mid-range includes the lower range attributes, and the high range includes the mid-range attributes. “I should mention there is nothing negative about being in the low range for some of the functional areas. There is no judgmental aspect to it. Some independent service providers are niche service companies. They may provide a small range of services, focus on those, and provide product offerings that are the basis of their service, so there are no negatives associated with being a low range.”
“Let’s also look in more depth at Functional Area #4, Safety and Quality programs. The attributes for the various levels in safety and quality starting at the low range, include a basic safety manual and program with minimal OSHA required documentation reporting. The high range would include OSHA 18001 certification. Also a safety track record would include a TRIR of less than 1.5. Quality is also very important and we think having a quality program that is compliant with ISO 9001 is a very good metric,” he said.
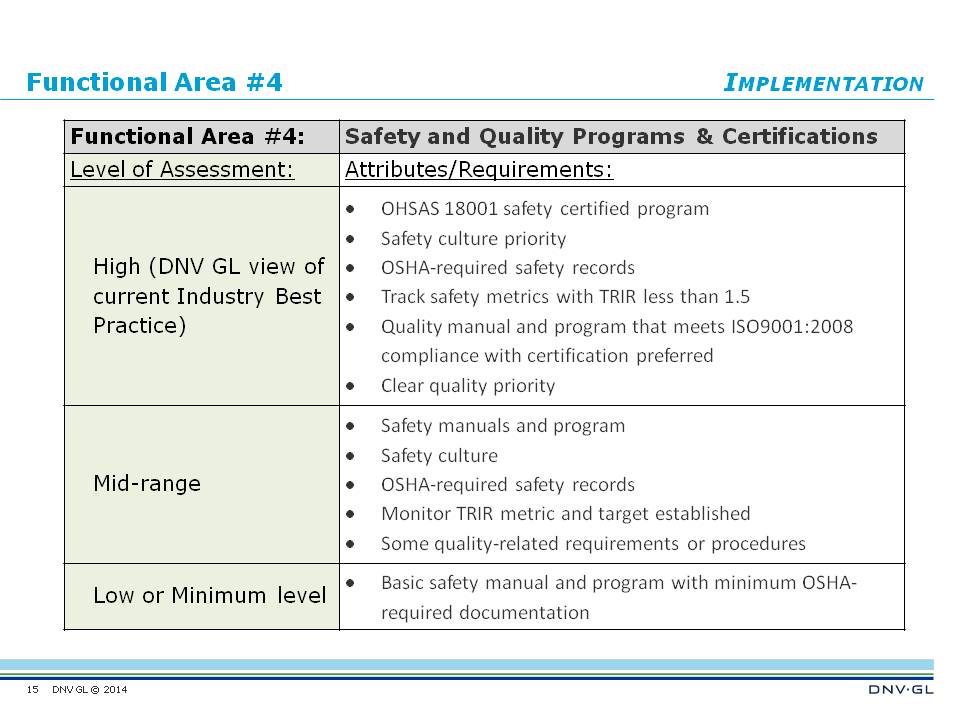
The survey results for Safety and Quality programs show that the bulk of participants put themselves in the high range. No survey participant put themselves in the low range. “I think it’s interesting to note that most survey participants did put themselves in the high level and yet, few were OSHA 18001 certified. Likewise on quality: only a couple of the participants were ISO 9001 certified. We think quality in particular is an important area and will be a differentiator among service providers going forward,” said Stovall. ISO certifications are important, he said.
“Let’s next look at Remote operation centers (ROCs) and engineering technical support, Functional Area #7. This is an important area and please note that no ISPs ranked themselves in the low range. The high range would require 24/7 remote monitoring with defined processes and procedures as well as other attributes. Typically, ISPs in this high range would be NERC compliant and utilize a centralized SCADA system. In the survey results, half the participants put themselves in the mid-range and I think there were two that indicated they had ROCs that were NERC certified.
The last functional area Stovall discussed was Financial Resources, Functional Area #10. This is important for industrial stability. The attributes span from the low range with low-to-no bonding capability, to the high range with bonding or letter of credit (LOC) capability as needed to meet essentially all customer requirements. “Sometimes, the high range ISPs would have the ability to include a parent company guarantee. Most ISP participants put themselves in the high range, but survey results have not been validated.” An accompanying circle graph shows the survey results for this area.
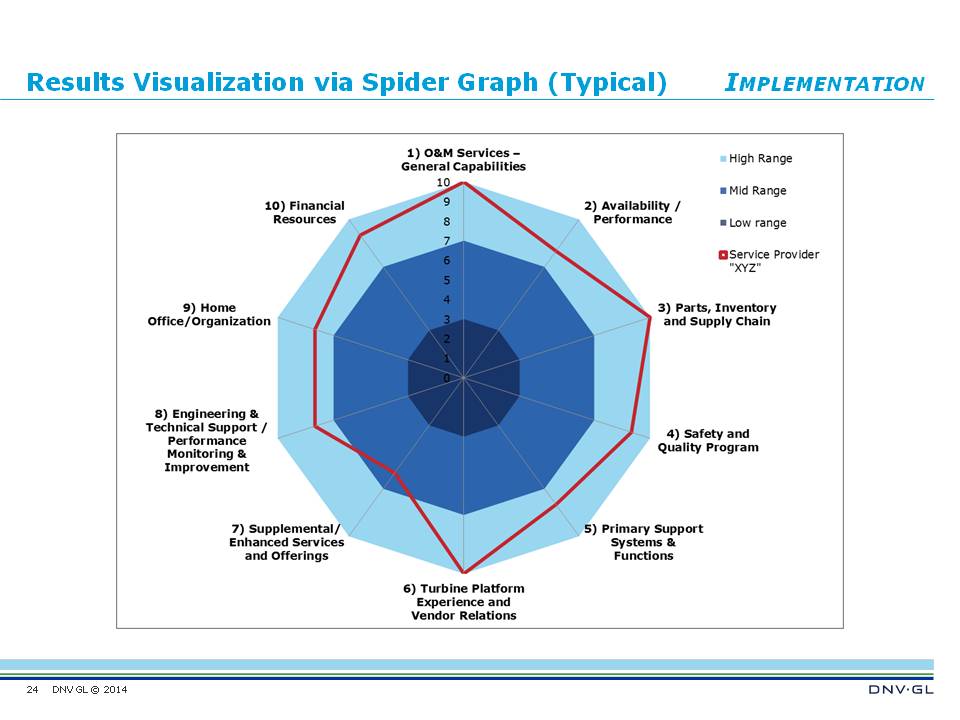
The spider graphs plots the results of a typical capabilities assessment. The dark blue inner circle represents the low range (or a 0 to 3 scoring), the medium blue intermediate circle is from 4 to 7, indicating the mid-range. The light blue is the high range from 8 to 10. The red line plots the results for a typical company in each of the 10 categories. For example, all participants ranked themselves in the high range for Function Area 1, O&M Service (general), while some ranked themselves lower in Area 10, Financial Resources.
Stovall thinks that the Service Provider Qualification issue is an industry-wide challenge, but also provides an opportunity. “It’s an opportunity for leadership. DNV GL wants to do its part. It sees the need and we’re looking for industry participants interested in working with us to continue the development and application of this framework. Stovall added that he is a member of an AWEA Quality Working Group involved in implementing initiatives and would welcome additional members. A possible next step would be to use the functional area list, including all the attributes, requirements, and metrics, and convert this to a spreadsheet with a checkbox or check-if-applicable type of input, resulting in a good useful template. The obvious use of this template would be in service-related Requests for Proposals (RFPs),” he said.
One possible future development of the approach is worth mentioning: Moving from a capabilities assessment to a performance assessment. “That is, moving to a more data-driven and result-based assessment rather than a capabilities-based approach. We also foresee the possibility of this becoming a certification. Right now it’s presented as a qualification program. However, turbines are certified; projects are certified; so, at some point it is possible that service will also be certified. Additionally, we think further adoption of the benchmarking framework may be driven by the financial or investment community, insurance stakeholders as well as proactive owner-operators and service providers,” said Stovall.
If readers have suggestions or would like to participate in further development or application of the benchmarking tool, contact Stovall at: darrell.stovall@dnvgl.com
Filed Under: News, O&M


