When the Department of Energy enacted the national efficiency standard for distribution-class transformers up to 2,500 kVA in 2010 (72 CFR 58190), it excluded Generator Step-Up (GSU) units. This was unfortunate because the industry continues to construct wind-collector networks with sub-optimal GSU transformers which lead to lower overall collector efficiencies, lower kWh sales, and longer project paybacks. The oversight ignores significant developments in GSU transformers that can alleviate such problems.
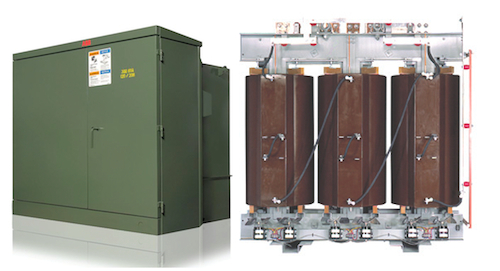
In the last year, ABB introduced a line of liquid (green cabinet) and dry type distribution-class transformers with amorphous-metal cores that significantly reduce no-load losses. EcoDry and Green-R-Pad transformers provide an optimal solution for applications in which average loadings are below 50% of nameplate rating.
Transformers financials 101
Every wind turbine has a GSU transformer stepping up the generator-output voltage from 690 to 34,500 volts. The transformer can be installed alongside the generator in the nacelle, or inside or outside the tower. Transformers inside the nacelle or tower can either be dry or liquid. Outside the tower, they have been liquid filled and pad mounted. The turbine OEM usually specifies and delivers the transformer, otherwise, it’s specified by the EPC or contractor. The OEM, EPC, or contractor delivers the specified efficiency. What the site’s owner and operator does not know is that GSU transformer efficiencies could be raised for a nominal additional capital outlay. Improved collector efficiencies lead to faster project payback and increased return on investment.
Distribution-transformer efficiency is impacted by the turbine output (volt-amp and power factor) along with transformer no-load (core) and load (winding) losses. Higher outputs and losses lead to lower transformer efficiency. Load losses increase as collector current increases. However, no-load losses are constant, no matter what the collector current. They are impacted only by the collector voltage. No-load losses come from magnetizing the iron core, which happens when voltage is applied to the transformer.
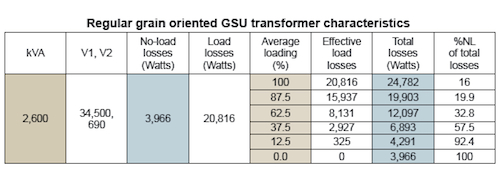 The collector network, including tranformers, are sized to the peak turbine output. But the actual average yearly turbine output is well below the peak. On average, wind turbine outputs are less than 50% of top ratings for a good portion of the year. The bar graphs in Annual turbine outputs shows a few production periods. Because these can vary from site-to-site, it is important to know the average turbine output or network loading for appropriately sizing transformer losses. Transformer manufacturers can customize the design to minimize whichever loss component has the greatest impact. In the case of wind sites, no-load losses become a significant proportion of total losses at those lower average loadings. The table (below) RGO GSU transformer characteristics lists a few values for conventional (Regular Grain Oriented – RGO) units.
Transformer manufacturers can reduce core losses by using a combination of a greater core cross-sectional area, increased number of winding turns, thinner laminates, or higher grades of material. Unfortunately, nothing comes free because an increase in core cross-sectional area and number of turns also increases winding (load) losses. And there are material limitations with regular-grain oriented (RGO) core steel when it comes to how thin one can make the laminates. So, transformer manufacturers have turned to amorphous metal (AM) as the material of choice for designs when average transformer loadings are below 50% of nameplate rating. AM properties allow manufacturing the material to 1/10 the thickness of RGO core steel, helping reduce core losses by 70 to 80%. Load losses do slightly increase for AM as compared to RGO due to an increase in core cross sectional area. However, the total losses at whatever load is less with AM cores. The table Amorphous metal GSU transformer characteristics lists a few values.
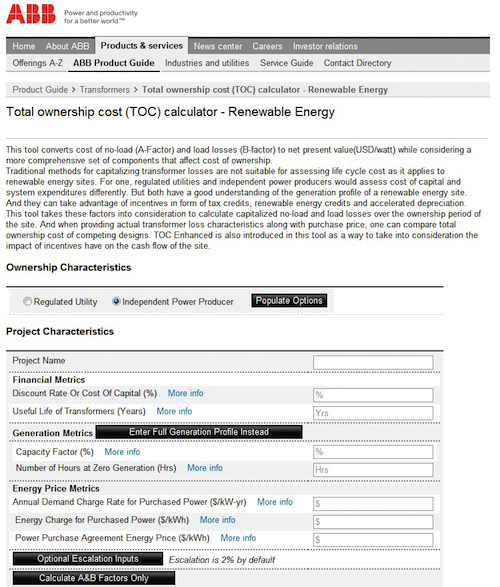
A total cost of ownership calculator is also available online at www.abb.com/transformers. (Select Transformer calculators, then Renewable Energy). It was developed by ABB and a financial modeling company for renewable project investments. Financials
When assessing the cost effectiveness of one transformer design over another, it is common practice for electrical utilities to capitalize the cost of losses (COL) over the life of the project. These capitalized losses are then added to the purchase price to find total ownership cost (TOC). Capitalizing losses takes the annual cost of no-load and load losses over, let’s say, a 20-year project, and amortizing it to present value (PV). When amortizing, one would need to know the cost of money or some interest above the prime lending rate. From the perspective of an owner and operator of a wind site, the collector losses are revenue (kWh) detractors versus cost of infrastructure to supply the losses, as is the case for utilities. But as a way to introduce the subject, we will use an electrical utility’s perspective. Later, we will take it from an Independent Power Producer (IPP) operating a wind site.
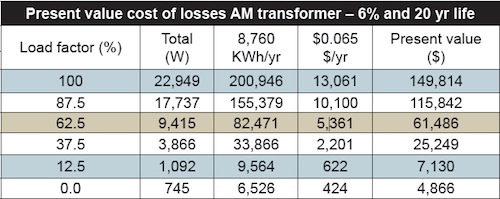
So, taking those previous RGO and AM transformer designs, we can make a PV calculation of the COL assuming an interest rate of 6% over 20 years. The cost for an electrical utility to supply the losses through its generation, transmission, and distribution infrastructure might be $0.065/kWh. We can assume some average transformer loads over 20 years. A more accurate representation would be an inflationary series in which general inflation, infrastructure cost, and loads increase over time. But for simplicity, let’s use a uniform series fixing all values over the 20 years.
First, calculate the annual cost ($/yr) to support the transformer losses. This is done by multiplying the total transformer losses (Watts) by the number of hours per year (8,760 h) by the infrastructure cost ($0.065 per kWh).
Then multiply the annual cost ($/yr) by the present value factor (PVF) to get the present value cost of losses.
 The following two tables (Present value cost of losses for RGO and AM transformers) shows this calculation for various trans-former load factors. Consider the 37.5% load factor for making a COL comparison. The result is the AM COL ($25,249) is 44% less than for the comparable RGO COL ($45,020) And the AM COL benefit grows as the average load factor diminishes.
TOC requires one last piece: the purchase price. In this case, let’s assume the AM transformer costs 20% more than the RGO version. If the RGO transformer costs $32,000, the AM unit costs $38,400. The RGO TOC would then be $77,020 ($45,020 + $32,000) while the AM TOC $63,649 ($25,249 + $38,400), so the AM transformer would cost 17% or $13,371 less.
So if one knows the losses within the transformer (or any other electrical device), one can financially assess the better option by comparing purchase price plus amortized cost of operation over the life of the devices. The equipment, from a present-value perspective, that costs less would be the best option. The hurdle is coming up with average figures over the life of the device.
 A case history
Now let’s turn our attention to an IPP owned and operated wind site. The IPP seeks to maximize its return on investment by operating as close to capacity as possible while minimizing losses across its collector network. The decision on how much additional capital investment to make to lower losses and improve collector efficiency depends on the return on the additional investment. Knowing this, we undertook a case study on a wind site in North America. We completed a load-flow study of the entire collector network that included 70, 2.3-MW turbines, 70-GSU transformers (2,300 kVA), 1-power transformer (100 MVA), and 530,000 ft of XLP / PVC cable.
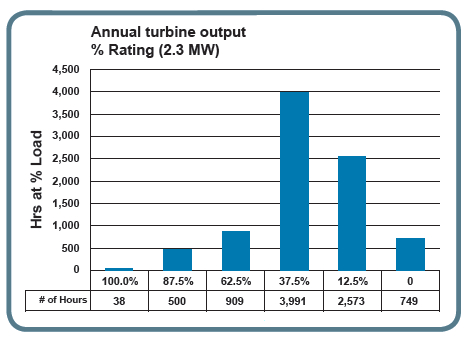 Note the negative energy sales during times of zero turbine output, indicating the wind site is purchasing power from the grid to energize the collector network. For the transformers, this is the no-load or core losses that are always present as previously noted.
The next step was to evaluate whether or not the additional 20% price for the 70-AM GSU transformers would be worth the investment. It amounts to less than a 1% additional investment in the primary equipment cost. A cash flow statement was prepared using a 20 year power-purchase agreement (PPA), 30% income tax credit (ITC), five-year depreciation on assets, unleveraged debt-investment, and $0.05/kWh demand charge for electricity.
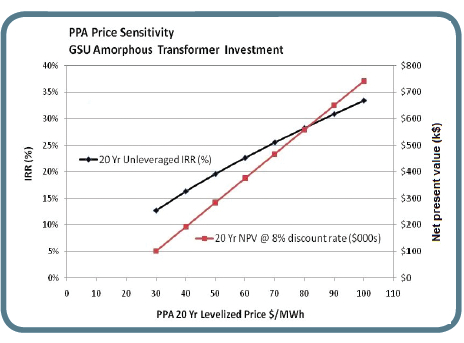 The PPA price sensitivity graph shows an Internal Rate of Return (IRR) and Net Present Value (NPV) of the additional investment at varying PPA prices. A $70/MWh ($0.07 per kWh) PPA would yield an IRR of 25%, an NPV of $467,000 (8% discount rate) and a simple payback of 3 years. Even a $50/MWh PPA agreement would yield an IRR of 15% and a NPV of about $300,000. So the additional cost for AM GSU transformers would be a good investment.
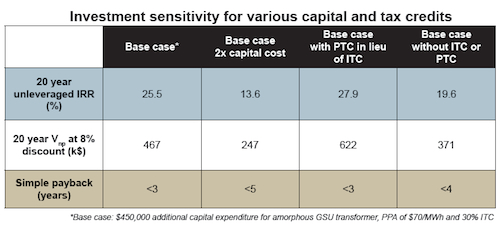
How would this picture look for other cases relative to capital outlay and tax credits (Investment sensitivity, Capital and tax credits)? Not so good if one doubles the investment for the AM GSU transformers, taking the IRR to less than 15% and a payback close to five years. However, one can increase the rate of return if the production tax credit would have been taken over the ITC. If neither of the tax credits would be taken, the return would approach 20% with less than a four-year payback. Hence, the outcome is sensitive to the investment approach.
 As for variation in turbine output, a load-flow study should be conducted for each load profile to know the losses within the collector network. Because it wasn’t done for this case study, cash-flow analysis was conducted comparing various kWh generation profiles without considering collector network losses. The base case had 64% of its MWh generated at or below 38% of turbines top rating. Varying turbine profiles were analyzed, progressively increasing the MWh generated above the 38% turbine rating. Although the IRR diminished, it remained above 20% even when only 24% of the MWh were generated at or below the 38% turbine rating. Because the AM GSU no-load losses are so much lower, the total losses remain below the RGO GSU design, even when the turbine is operating near its top rating.
Optimally, a load-flow study should be done to compare the internal rate of return of various technical solutions and conducted ahead of tendering or procuring the transformers. As it is today, transformer manufacturers are asked to tender an offer on the basis of not exceeding certain losses. Unfortunately, this approach limits equipment optimization to the specific wind site.
There is an alternative, however, that allows reporting financial and generation profiles at the time of tendering the transformers without divulging particulars. Also, the transformer manufacturer gains the flexibility to design a best transformer for the specific wind site. The alternative would provide at the time of tender, no-load (A) and load (B) loss capitalization factors ($/Watt) unique to the wind site. These factors give the transformer manufacturer enough information to find a cost effective or lowest TOC design. The purchaser then selects the transformer design having the lowest TOC by multiplying the transformer losses by its associated factor and adding them to the price. For example:
![]() Where P = price of the transformer ($), A = No-Load capitalization factor ($/W), B = Load Loss capitalization factor ($/W), NL = No-Load losses of the transformers (W), and, LL = load losses of the transformer (W).
Where P = price of the transformer ($), A = No-Load capitalization factor ($/W), B = Load Loss capitalization factor ($/W), NL = No-Load losses of the transformers (W), and, LL = load losses of the transformer (W).
The article provides insight on how to evaluate the financial impact of transformer losses on a wind site. Owner, operators, and investors should realize that for a nominal additional investment, typically less than 1% of primary equipment cost, the project payback can be lessened and returns improved. Such financial opportunities must be taken into consideration when setting project budgets. Transformer tenders should use the principle of total-ownership cost when selecting a design.
Douglas M. Getson P.E.
ABB Global Podut Manager
Distribution Transformers
Jefferson City, MO.
www.abb.com/transformers
WPE
Filed Under: Financing, Policy


