By Paul Dvorak | Editor
Windpower Engineering & Development
With interest in the wind industry growing nationwide, localities in which the farms are considered would probably like to know their financial impact. You could hire an accountant for a few guesstimates, but the Energy Department’s National Renewable Energy Laboratory might have better answer and sooner thanks to JEDI. It is the Jobs and Economic Development Impact model, and in particular, the Landbased Wind Model. (The joke at Federal labs is that no project starts without first defining a clever acronym).
The good news is that the program, actually an Excel spreadsheet, is free and here: www.tinyurl.com/nrel-jedi. You will see right away that NREL has been busy. It offers at no cost about 18 programs under the Jedi umbrella, all in Excel, and with user notes for five of the more complex programs. Models are also available for projects that deal with biofuels, solar, natural gas, and even coal projects. Two other wind energy models address distributed wind and offshore projects. While this is mostly a program-only site, users can pose questions to JEDISupport@nrel.gov.
We’ll focus on the land based, wind-farm model. After you accept the restrictions, the model downloads along with some default values and figures for a demo wind farm. However, your Excel will probably require that you allow the operation of macros. For Windows users: Pick the Windows symbol, upper left in Excel, Excel options, Trust Center, Trust Center Setting, and then Enable all macros.
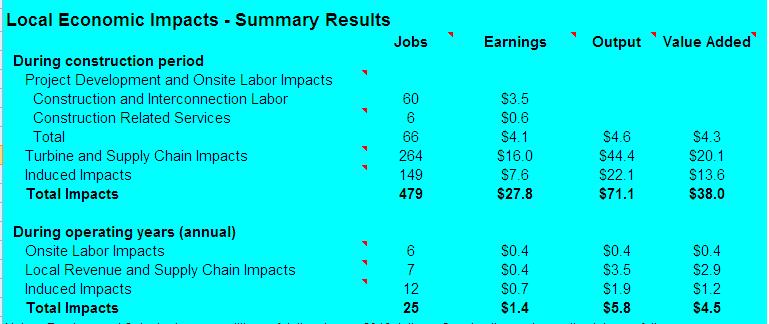
The model takes only a few inputs such as the number of turbines, wind farm nameplate rating, its cost, and location. We invented a 100-MW wind farm for Ohio with 50 turbines, and the model provided a wide range of values. For instance, the model says that 60 jobs will be created for Construction and interconnection labor, 149 more from Induced impacts, and others for a total impact of 479 jobs. What may be of equal interest to the community around the site, the model predicts a Local revenue and supply chain impact of $400,000 and local spending could reach $666,209.
There are well over 100 calculated quantities in several categories. For instance, construction costs break into Equipment and Balance of Plant along with a local share. None of the equipment (turbines, blades, towers) will be locally sourced (it’s in Ohio) although most of the Construction material (concrete, rebar, roads) and Electrical will come from local firms.
That answers the question in the headline but the model does not stop there. The Wind farm – Project summary data, in an accompanying table, details other items such as a Total installed project cost of $206 million and local spending of $45.8 million.

So how accurate are the figures? “There have been a few periods in which we evaluated the outputs of the model and executed some recalibrations,” says NREL software developer for JEDI and energy analyst Eric Lantz. “Most of our work focused on the onsite portion of job creation. That part is relatively easily tracked, the number of construction workers onsite and the number of people that service the facility once in operation. Calibrations have been informed by looking at data from across a large but not comprehensive sample of projects,” he says.
For other portions of the jobs reported, such as indirect and supply chain induced, Lantz says his team has done work to determine the share of goods and services provided to the plant by local vendors. “It should come as no surprise that we found those figures vary widely across projects. The default functions for these parameters are intended to be representative and grounded in observed trends we saw, but users should adjust those numbers for their specific project of interest because the results are relatively sensitive to where you manufacture and procure the equipment and services that go in to the project,” he adds. 
Filed Under: Financing, News, Software


