Nagore Guarretxena, Health Monitoring Engineer, NEM Solutions, www.nemsolutions.com
The case study presented here demonstrates how SCADA data and expert technology makes it possible to detect wind-turbine failure symptoms that make it possible to optimize the dynamic scheduling for wind turbine operation and maintenance.
Comparing graphs and spotting symptoms
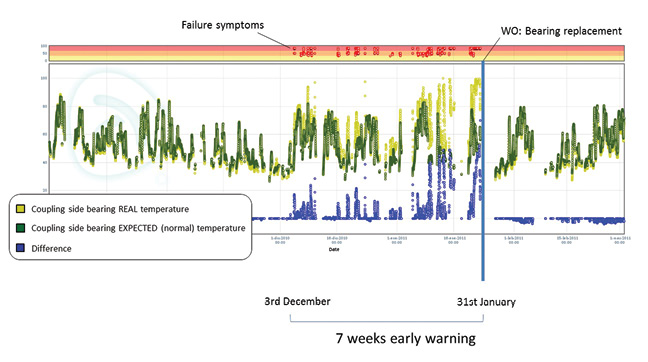
Big data and neural network techniques could be used to achieve similar results, but such graphs are difficult to interpret. Nonetheless, the chart shows that these predictive techniques reveal the first symptoms seven weeks before placing the work order for the bearing replacement.
This article analyzes the O&M optimization project of a real wind farm. First we examine the context of the case study along with objectives and challenges. Then we will discuss what was done to achieve the objectives, and finally we look at the results. From this article, the reader will:
• Learn which critical components fail most often
• Understand the impact of the resulting downtime and loss of energy production
• Discover the power of advanced monitoring techniques through real- world examples of predicted failures, and
• Explore the LCOE reduction obtained at different wind farms with different wind turbine OEMs and models.
A user friendly interface
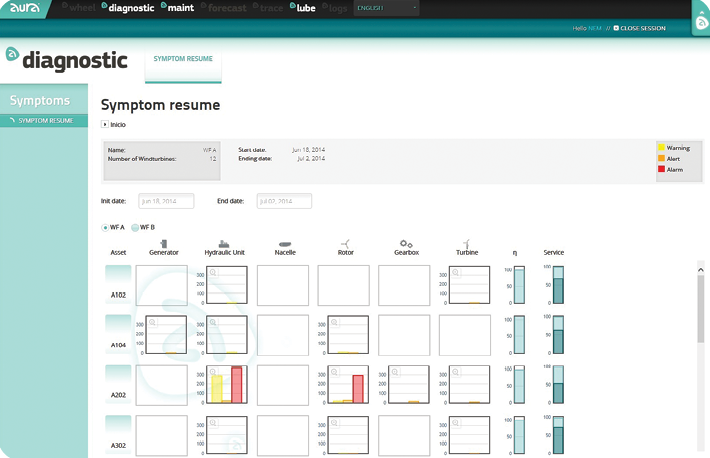
The AURA user interface is a bit easier to read than a chart with several graphs. Each row represents one wind turbine and the columns show the different subsystems of the turbine. At a glance, it is possible to check the health of each turbine in detail. For instance, the hydraulic unit in turbine A202 has passed a warning stage and is now in an alarm state.
The case study includes three years of data collected from wind turbines of several sizes. During this period SCADA data as well as maintenance interventions from historical information were considered to achieve two main objectives: First, lets determine which types of failures are predictable by this technology, and second, calculate the cost reduction that comes from avoiding catastrophic failures by converting unplanned shutdowns to scheduled maintenance before the downtimes occur. The challenge was to use only the available data, without installing extra hardware.
The complete case study includes:
• Three wind farms, 95 MW total
• Two turbine technologies, 0.85 and 2 MW
• SCADA data of about 50 variables per turbine
• Data collection over a span of 32 months, from 2010 to 2013
• AURA diagnostic software, and
• About 6,000 work orders
The expert system used in the case study, A.U.R.A, uses the standard ISO IEC 61400-25 classification or codes to organize the different subsystems of the wind turbines. For example: WROT (Rotor, blades, pitch), WTRM (gearbox), WGEN (generator), WNAC (environmental issues), WHDR (Hydraulic unit), WYAW (Yaw, orientation), and WTUR (power and performance).
What’s wrong with the gearbox in A501?
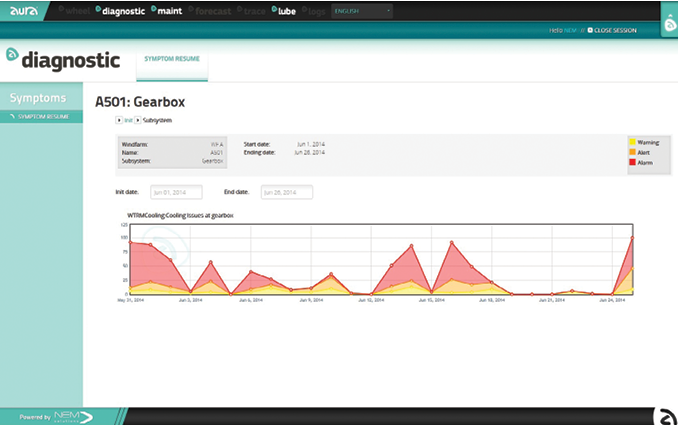
Turbine A501 is having gearbox problems, high temperatures in particular. Graphs of other ISO codes will help better focus a diagnoses.
The method starts by analyzing historical SCADA data. Different signals coming from key points of wind turbine components (temperature, pressure, speed, power, rotation angle, electrical variables, and environmental variables) are studied and correlation is sought between different signals and conditions. Next, normal behavior models for each SCADA input variable are created, and failure symptoms are designed by generating rules based on those normal behavior models.
Once the normality models are created and the system is configured, AURA is launched: Real time parameters are continuously compared with the expected value (normality model) of each parameter in each moment. Combining the results of these comparisons and analyzing key parameters allows detecting anomalies and predicting future failures.
The last step is to analyze work orders to determine predictable failure types, evaluate the predictions made, and calculate savings.
To illustrate this point we use a prediction example of one of the Gearbox bearing temperatures. The illustration Comparing graphs and spotting symptoms shows:
• The real temperature measured by SCADA in yellow
• The expected value of the temperature in green, the normal model
• The difference obtained from comparing one to the other appears in blue
• The red points above indicates the symptoms of failure explained above
• The vertical blue line indicates a work order (WO) related to this specific failure.
The role of work orders
There are five central types of maintenance: Large corrective, Small corrective, Preventive, Modification, and Test. Small and Large corrective are the most frequent types of maintenance. Catastrophic failures occur mostly at the generator, rotor, and gearbox. Of the work orders, 48% are associated with a main subsystem and 52% are from other sources.
The gearbox and the rotor represent the highest number of work orders, followed in order by the generator, turbine, nacelle, yaw system, and lastly, hydraulic units.
Moving on to the analysis of the downtime as preported by maintenance personel, 74% of the analyzed work orders are associated with a subsystem and 26% are for other matters.
In this case study, the rotor caused the most downtime followed in order by the controls (turbine), gearbox, yaw, hydraulic unit, generator, and nacelle.
If we compare downtime with the previously analyzed proportion of work orders classified by subsystem, it can be shown that downtime is not equally related to the number of maintenance operations in all subsystems.
The results show that most of the common failures, such as bearing related issues, oil overheating, oil level related, and pressure issues are predictable in all subsystems as well as blades and pitch-related problems. On the other hand, gearbox-bearing-related issues and communication related problems are harder to detect at an early stage.
Indicators of early failure
Each major wind turbine component has trouble indicators. Here are a few:
Gearbox problems are indicated by: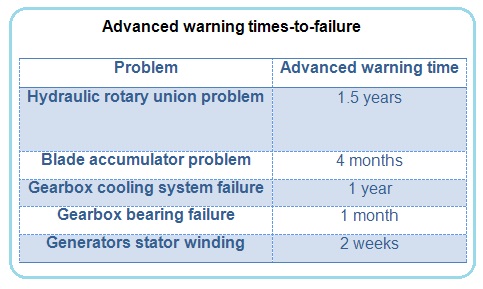
• Overheated oil
• Low oil levels
• Bearing-related issues
• Cooling system issues
• Sensor reading errors
Generator problems are indicated by:
• Bearing-related issues
• Winding (coil) related issues
• Generator speed discrepancies
• Sensor reading errors
Hydraulic unit problems are indicated by:

Author Nagore Guarretxena
• Oil overheating
• Hydraulic unit oil pressure issues
• General accumulator pressure issues
• Oil leakage
• Sensor reading errors
Rotor problems are indicated by:
• Blade speed issues
• Pitch-related issues
• Blade accumulator-pressure issues
• Sensor reading errors
Nacelle problems are indicated by:
• Anemometer errors
• Vane-related issues
• Sensor reading errors
Yaw problems are indicated by:
• Yaw unit oil pressure issues
• Yaw system discrepancies
• Sensor reading errors
Power and performance (WTUR) problems are indicated by:
• Power curve discrepancy
• Performance related issues
AURA users achieved significant savings by avoiding unplanned shutdowns and the energy loss caused by downtime. Savings of more than $2,700/MW per year are possible by using existing SCADA data. It is important to highlight that the more input data used the more accurate predictions will be made.
All wind farms generate valuable information. Combining this already available information with expert knowledge and the appropriate tools allows the early detection of failure symptoms, and that trims significant O&M costs. WPE
Filed Under: News


