Barry Logue · Wind Energy Application Manager · Vaisala Inc. Energy – Measurements · www.vaisala.com
A few recent tools that help with the continuous operational optimization of a wind farm include remote sensing and advanced mesoscale computer models.
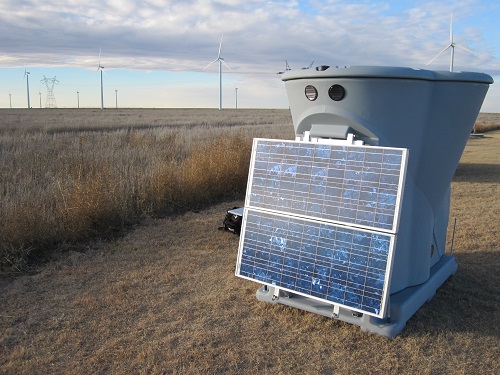
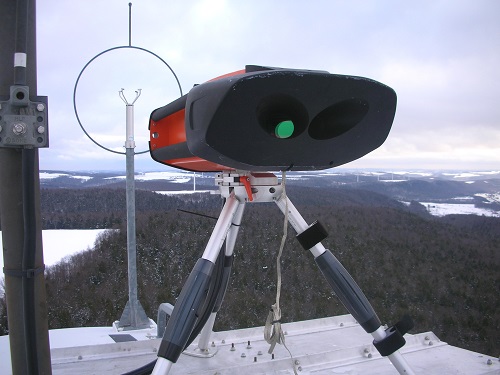
Remote sensing units, such as the Triton SoDAR, collect wind speed and direction data on wind farms with the advantage of being mobile. This unit runs on batteries that recharge from the solar panel, and it collects wind data up to and above hub height.
As the wind-power industry matures, project developers, owner-operators, and financiers are asking for more reliable predictions of power output from new construction and existing assets. Industry studies that have analyzed production data from operating wind power plants indicate greatly improved accuracy from preconstruction estimates compared to actual performance. However, long-term climate variability, such as last winter’s polar vortex, evolving energy markets, repowering contracts, and financial vehicles such as YieldCos are driving a need for continually increased certainty in expected future performance from wind-power plants.
This is required to better understand portfolio risk and to drive incremental operational improvements for getting the most out of the existing steel in the ground. Fortunately, there is a wide range of hardware and software to collect and analyze a steady stream of data to better understand and enhance turbine performance. Some of the newest tools available for operational optimization are remote sensing and advanced mesoscale computer models. Modeling and remote-sensing instruments, such as traditional anemometry, play three basic roles in the life cycle of a wind
project: prospecting, assessment, and operations. Here we will focus on the operational applications of remote sensing and advanced computer modeling for continual windfarm optimization. When properly leveraged these technologies offer site-specific data for performing an operational assessment and improving on-going production.
Remote sensing
Remote sensing has been used commercially for decades in the wind industry as a pre-construction measurement tool. However, the unique capabilities of remote sensing have been put to use in a variety of operational applications specially
because the focus in more mature markets is switching from rapid development to optimization of the existing wind-turbine assets. These areas of operational optimization include:
• Making investment decisions for upgrades and new equipment
• Analyzing yaw, wake, and other losses factors
• Developing mitigation strategies to minimize energy losses, and
• Accurately forecasting production for scheduling energy and turbine downtime for maintenance.
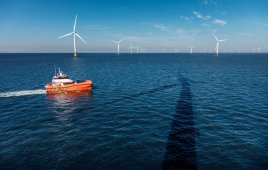
Remote-sensing systems, such as ground-based SoDAR (sonic detection and ranging) and LiDAR (light detection and ranging), provide developers with the means to measure wind speeds at and above hub heights to better estimate production for today’s large rotor, utilityscale wind turbines. With these modern measurement instruments, the industry has developed a greater understanding of how wind characteristics such as atmospheric stability and directional shear (variation of wind direction versus height) affect turbine-power performance.
Monitoring wind conditions in and around an operating wind farm is traditionally accomplished with wind-measurement equipment mounted on the top of the nacelle (or turbine housing) or by permanent meteorological or met towers. Turbine mounted equipment is affected by the turbine and is not representative of the free-stream wind coming into the turbine array. Met towers are typically used to conduct one-time tests to verify the power performance of nearby turbines, according to the turbine supply agreement, and then provide data to regional electrical balancing authority for forecasting purposes. Post-construction comparisons of production data to pre-construction forecasts are often challenging because many wind-measurement sites used for resource assessment are not used to site the permanent power-performance met towers.
The forward-looking LiDAR system is mounted on a turbine nacelle to measure incoming speed and direction. The data helps improve yaw correction, blade-pitch-control strategies, and potentially early gust and ramp-down detection.
Wind farms often operate with just one or two met towers as reference sources, towers which were originally used for the contractual power-performance test. Once turbines are installed, wind information from the fixed met towers is used to monitor production estimates and as an aid to operations and maintenance. However, the met tower may only represent a subsector of the wind turbine array. The demand for operational assessment analysis is being addressed using a combination of advanced mobile ground-based remote sensing instruments and advanced-modeling techniques. An advantage of a mobile, remote-sensing instrument is that it can be moved around and within an operating wind-turbine array to provide the project owner-operators access to specific sector wind data that they can use to assess their operational control strategies and predict specific turbine maintenance needs.
As wind-turbine technology improves, existing wind farms must regularly evaluate whether to invest in a manufacturer’s performance enhancements, such as vortex generators, new SCADA (supervisory control and data acquisition) algorithms, and other modifications. By using a remote-sensing system as a mobile met tower, relative power curves can be developed for pre-upgrade and post-upgrade analysis to better understand the benefits of various improvements under varying wind conditions. After installing the upgrades, monitoring the free-stream wind flow provides better information for determining whether the upgrade produced an improvement or it was simply a ‘better’ wind day. Also, if the blades or software are updated, that might change the transfer function of the nacelle anemometer – making upwind free-stream measurement all the more important.
Additionally, wind-farm operators are investigating the use of forward-looking nacelle mounted LiDAR systems for improved yaw correction, blade-pitch-control strategies, and potentially early gust and ramp-down detection. Several of these nacelle-mounted LiDARs use the Doppler-shift measurement techniques used by ground-based models. However, new direct LiDAR detection methods are in test and early results are promising. Several providers offer such systems. Whether it is necessary to install a forward-looking LiDAR on each turbine or only on a few key turbines to provide the necessary guidance is still under investigation because wind direction variation across a project site will likely influence that decision.
Wake losses
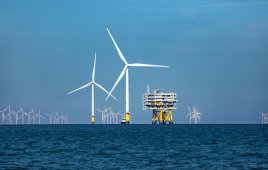
Another loss factor and one of the most important steps in wind-project valuation is the estimation of wake effects. These occur when upwind turbines create turbulence that detracts from downwind turbine performance. Wind-project wake losses make a substantial contribution to understanding wind plant under-performance, and in many cases may be the largest contributor to such under-performance.
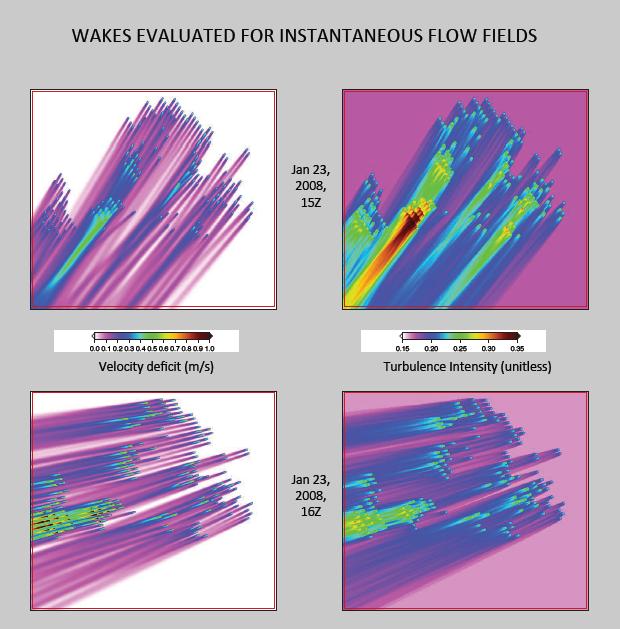
The snapshots of velocity deficit (left panels) and turbulence intensity (right panels) come from a 166 turbine wind park and span two individual hours in 2008. The bottom panels occur one hour after the top panels.
Remote sensing systems can play a role in measuring these effects at operating wind farms, but can also calibrate and test various advanced-mesoscale models used for wake analysis. Studies conducted by Vaisala’s 3TIER Services and WindLogics have shown the skill of the Weather Research and Forecasting (WRF) model in this application.
Several hypotheses explain why the WRF model provides a more accurate estimate of turbine wakes. Foremost, WRF takes into account the variability of the atmospheric vertical-temperature profile, which strongly controls the amount of turbulence available to dissipate turbine wakes. Standard wake models assume neutral atmospheric stability. Neutrally stable flows let wakes dissipate more rapidly than they would in the more strongly stable conditions typical of the nocturnal boundary layer. Although WRF is more computationally expensive, the results of these studies show that using WRF to model wind turbines and nearby existing or planned wind plants is the best method to ensure that the total waking effect has been appropriately captured.
These findings are significant because computer simulations are the only option for evaluating wakes prior to construction. Advanced mesoscale models also offer flexibility for operational optimization because they can quickly provide a modeled wind profile at each turbine with wake losses incorporated, which can be compared with actual production on an ongoing basis – all without the expense of installing, maintaining, or collecting measured data at each turbine.
Working with the grid
Finally, a wind project’s generation must be integrated predictably into the power grid for system reliability and to fulfill its expected financial return. Regional independent system operators (ISOs) thus require wind generation facilities to provide forecasting data, which they use to understand how much power a wind generation facility will be supplying to the grid on a day-ahead and hour-ahead basis.
ISOs also need wind forecasts to predict so-called “ramp events.” This is a period of rapid change in wind-farm production caused by increases or decreases in wind speed over a few hours. Different grid systems operate in their own unique wind regime and therefore, have different definitions of wind ramps. ISOs and wind-farm operators must have operating strategies in place to deal with impacts these events have on generation capacity and system reliability. Energy traders also use wind forecasts to determine the amount of power that will be available at any given time, because this will drive prices up or down.
Accurately forecasting wind-energy production requires measurements and advanced computer modeling. First, measurements of the current wind resource are recorded at and around the wind-farm site. These data along with that from national and global weather service forecasts are combined with high-resolution Numerical Weather Prediction (NWP) models such as WRF. Forecasts are based on these weather models along with knowledge of the capacity of the turbines and their predicted power output in various wind conditions.
NWP models are typically initialized with gridded data sets from the national weather service. By nature, these are at least one hour old by the time they can be accessed, ingested, and processed by the modeling software. Therefore, in many locations, forecasting in the hour-ahead time frame can be improved with onsite wind observations. Analysis of local weather conditions using a network of ground-based remote sensors can assist in turning forecast models to site conditions. These mobile wind-measurement systems offer a new source of data to feed today’s robust microclimate forecasting models. By combining remote-sensing measurement technologies with advanced computer-modeling techniques in forecasting, owner-operators can improve the cost competitiveness of wind power generation compared with traditional fossil-fuel generators in electrical markets around the world.
Looking ahead
The wind industry is deploying more advanced-measurement technology, turbine-performance enhancements, and forecasting systems to optimize wind-power generation for better grid integration. Ultimately, these will improve the value of wind energy in a utility’s generation portfolio. Improvements to remote sensing and advanced computer modeling enhance operational turbine performance. These advancements include new SoDAR and LiDAR instruments developed for studying active wind farm conditions, such as SCADA integrated permanent SoDARs and nacelle-mounted LiDARs. Used either as a complement to met tower data or as a stand-alone tool, remote sensing systems and advanced modeling software can be used throughout the lifecycle of a wind farm. Through innovation, in hardware and software, wind farm developers and financiers can reduce the uncertainty of wind-power generation and make it a more attractive component of modern energy investment portfolios. WPE&D
Filed Under: Featured, O&M