Ian M. Hoffman, Greg Leventis, and Charles A. Goldman
Lawrence Berkeley National Laboratory
This technical brief presents trends in the cost of saved electricity for energy efficiency programs between 2009 and 2013. We collected and analyzed more than 5,400 program years1 of data collected in 36 states from 78 administrators of programs funded by customers of investor-owned utilities. These administrators provide efficiency programs to customers of investor-owned utilities that serve about half of total U.S. electricity load. Our key takeaways include:
 We find that the cost to efficiency program administrators of saving a kilowatt-hour (kWh) averaged $0.028/kWh over the five year period. The average program administrator cost of saved energy (PA CSE) declined from $0.044/kWh in 2009 to $0.023/kWh in 2011 and then rebounded slightly to $0.028/kWh in 2013.
- In the commercial, industrial (C&I) and agricultural market sector, the PA CSE averaged $0.027/kWh over the five-year period but showed a modest upward trend between 2011 and 2013. In the residential sector, the PA CSE averaged $0.035/kWh in the residential sector but declined significantly from $0.071/kWh in 2009 to $0.030/kWh in 2013.
- A somewhat different picture emerges if we weight the PA CSE values by annual electricity savings, which tends to give more influence to program administrators that are managing larger portfolios of programs. The savings weighted average CSE increased from $0.020/kWh in 2009 to $0.023/kWh in 2013, averaging $0.022/kWh for the five-year period. These administrators are often quite experienced, have generally been pursuing energy efficiency opportunities longer and are likely to have acquired a larger share of the least costly savings.
- We also examine trends in the PA CSE over time for different types of programs: residential lighting, behavior based programs, and whole home retrofit, and C&I custom and prescriptive rebate programs.
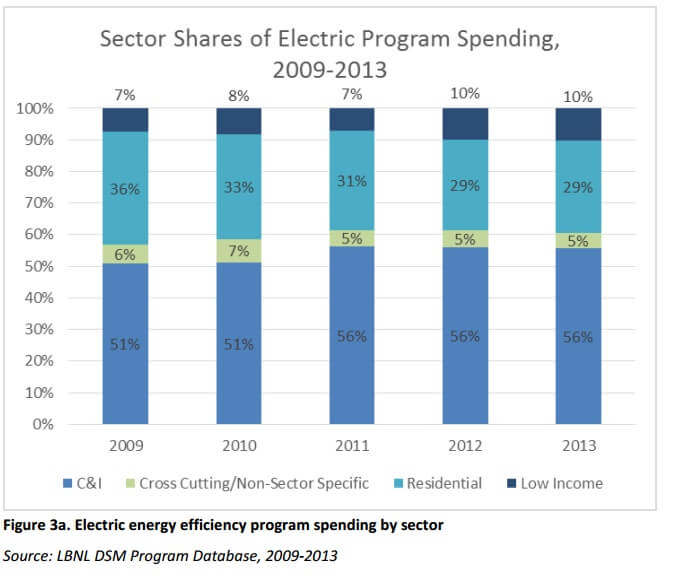
- The relative share of spending for residential sector programs declined somewhat during this time period (35% of total spending in 2009 vs. 29% in 2013), while the relative amounts spent on commercial/industrial sector programs increased somewhat over this period (51% of total spending in 2009 vs. 57% in 2013). Spending for low-income programs accounted for 7 to 10% of total spending during this period.
Our future work will continue to track trends in the cost performance of efficiency programs by incorporating program data for 2014 and 2015 and will examine potential influences on the cost of acquiring electricity savings in more depth. 1 A program year is a year’s worth of data for each program in the LBNL Demand Side Management Program Database. For example, data covering four years of spending and impacts for a particular program would amount to four program years
For the full 16-page report: https://emp.lbl.gov/sites/all/files/lbnl-1007009.pdf
Filed Under: Policy


