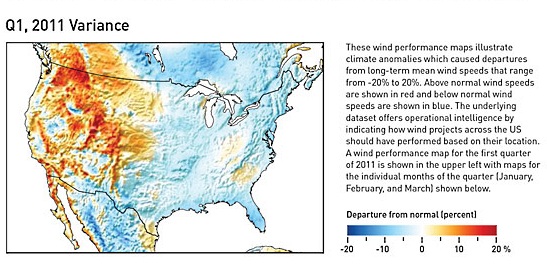
A wind performance map for Q1 2011 illustrates that wind speeds were above their seasonal averages for large areas across the Western U.S. 3TIER’s map shows the rest of the country experienced slightly below average wind speeds, including a majority of Texas, the Midwest, and the East.
The map illustrates departures from long-term mean wind speeds that range from -20% to +20% and provides an indication of how wind projects should have performed relative to their long-term production average based on their location. Looking at wind speeds during the first quarter of 2011, the pattern is 0 – 20% above normal in the western half of the country and 0 – 5% below normal in the eastern half. However, the first quarter map does not illustrate the significant wind speed variability that occurred month to month throughout the beginning of 2011.
Of the three months, 3Tier says January was a clear outlier, with well below normal wind speeds across the entire country except in the higher elevations of the Intermountain West and in isolated areas of southern California and Arizona. This was caused by two large-scale atmospheric circulation patterns: a weak La Niña and a strongly positive Pacific/North America (PNA) pattern.
In contrast, February and March saw increased wind speeds across the entire Western U.S. – keeping with the 3-month average pattern. However, over February and March the Eastern U.S. also experienced above normal wind speeds, but few high enough to cancel out the substantially below average wind speeds that occurred in January.
February showed considerably elevated wind speeds nearly everywhere in the nation. This was due to the severe winter storms that dominated the month, which were caused by a PNA pattern shift from positive to negative and the strong La Niña originally predicted for January. In March, climate conditions were characterized by a weakening of La Niña, a less positive PNA pattern, and a transition from a weak positive to a weak negative North Atlantic Oscillation. Strong frontal systems also moved across the southern part of the country, producing severe weather and contributing to the elevated wind speeds in that region.
The wind performance maps were created by comparing output from 3TIER’s continually updated meteorological dataset with wind conditions averaged over the period 1969-2008 from the same dataset. Wind speed values were computed using a numerical weather prediction model run at a 15 km resolution and adjusted using available observations. The underlying datasets for the wind performance maps provide clients with operational intelligence for every location within a region and are available in nearly all regions worldwide.
3Tier www.3tier.com
Filed Under: Policy


