This post provides an overview of the report’s key findings.
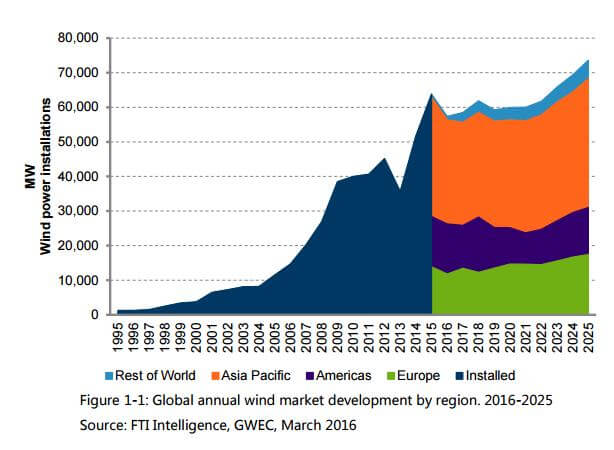
Additions of wind power capacity set a new global record in 2015 at 63.8 GW. Key drivers for the record volume of new wind capacity installed in 2015 include:
 Developers rushed to complete projects ahead of regulatory changes to markets in China, Germany and Poland aimed at controlling sector growth and profits.
- The United States and India maintained their recovery from 2014 following their governments’ reinstating of key market drivers in 2014.
- Strong growth in France, Turkey, Brazil, Mexico, South Africa, Ethiopia and other emerging markets in Latin America and the Middle East. The record installation may disguise underlying challenges still facing the wind industry.
In fact, a period of volatility is now expected for global wind market growth after worldwide installation of new wind power capacity reached a new peak in 2015. Roller coaster growth is forecast over the next five years, with a series of annual downs as well as ups before our predicted next peak in annual wind capacity additions in 2023. FTI Intelligence is forecasting that additions of new wind power capacity globally will fall by 10% in 2016. The market slowdown is mainly a reflection of an expected dip in wind power’s fortunes in China, which coming off the back of an extraordinary year of market growth in 2015 will likely return to a relatively rational pace of development during the country’s 13th Five-Year Plan period for the national economy (2016-2020).
In Europe in 2016, new support mechanisms being introduced in some major national markets, such as Germany and Poland, may trigger a fall in additions of new wind capacity, with a period of European market stagnation to follow through 2017 to 2019. Meanwhile, expected growth in the U.S. and in the emerging markets of Latin America and Africa during the same period will be strong enough to compensate for Europe’s stagnation, bringing the global market’s annual incremental growth from -10% in 2016 to 5.4% in 2018. In 2019, however, the phasing-out of wind’s federal production tax credit (PTC) in the United States begins in earnest and is likely to have repercussions on global wind market growth as well as on the domestic market.
Annual incremental growth worldwide is forecast to turn negative that year, reflecting an expected 40% decline in the American market after its likely record performance in 2018. A slow recovery for the global wind market is predicted to follow in 2020, with the annual addition of new capacity increasing to 1%, but a further global decline is probable in 2021 after the PTC is finally terminated.
Despite the ups and downs, we predict that the strong momentum of the global transition to clean energy, strengthened by the commitment made to reducing climate change emissions by the 195 countries who signed up to the Paris agreement at COP21, will see the global wind market recover from any faltering from 2022. Additions of new wind power capacity are forecast to grow from annual installation of 59 GW in 2021 to annual installation of 73 GW in 2025, bringing the cumulative installation to 1,060 GW by the end of 2025.
For the entire 10 year period from 2016 to 2025, FTI Intelligence predicts a compound annual growth rate (CAGR) of 9.4%. As the world’s largest wind market, China strongly influences the global picture of wind development.
The country accounted for 48% of new capacity globally in 2015 and its dominance is expected to continue through 2025.
Exclude China from our global market forecast, however, and the picture changes. The forecast with China reveals an average increase in annual capacity additions across ten years of 1.4%. Without China, the annual average increase more than doubles and could reach 3.3%. Whether China is included or not, global market growth is still expected to be negative in 2016, 2019, and 2021, reflecting the challenges in established European countries and the phasing out of the PTC in America.
The impact on CAGR of China’s exclusion from the 10-year forecast is apparently more benign. Exclude China and the global wind market’s CAGR drops about 1%, from 9.6% to 8.7%. The main explanation for the comparatively low average percentage number for year-on-year growth over 10 years lies in the large volume of wind capacity installed in the base year. The 2015 capacity addition was the highest ever. There is no denying, however, that the significant changes to wind market structures in Europe, the phasing out of the PTC in the U.S., the instability of the Brazilian market in the middle of the 2016 to 2025 period and China’s return to a more rational pace of development are also part of the explanation for slower growth looking forward.
For the full report: Demand_Side_Analysis_2015_media.pdf
Filed Under: Construction