Sandia is continuing its development of rotor-based offshore Structural Health and Prognostics Management (SHPM) with Vanderbilt’s Laboratory for Systems Integrity and Reliability (LASIR).
In 2012, a multi-scale modeling approach was used to identify how rotor dynamics are affected by pitch error, mass imbalance, and shear-web disbond – detection methods for these conditions were developed and evaluated only for standard constant inflow conditions. Commencing in 2013, an aerodynamic sensitivity analysis of the model was performed in which several inflow conditions were varied (including wind speed, turbulence intensity, and shear) to examine the ability of these detection strategies for pitch error, mass imbalance, and disbond to perform under realistic and varying inflow conditions. Results were presented in January 2014 at the ASME Wind Energy Symposium. Recently, a more comprehensive summary of these results were published in a Sandia Technical Report which included a cost analysis. The sensor configurations used for these detection strategies can be found in both reports.
Based on the results of the aerodynamic sensitivity analysis, the detection strategies were refined for each of the damage or fault conditions with probabilities of detection (POD) calculated for sensing the presence of each fault in addition to categorizing the fault into different levels or states of severity. Although results have been generated and documented in the above reports for all three damage conditions, we use the case of mass imbalance to illustrate the key results. Each imbalance was assigned a set of thresholds corresponding to the severity of the imbalance, as shown below in the table.
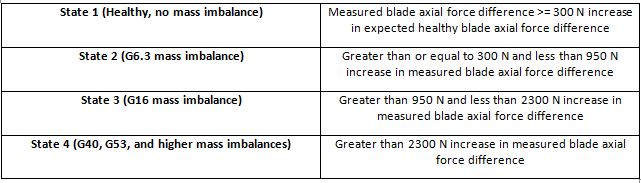
Mass imbalance damage state and corresponding feature used for classification
Probability of detection values were calculated for detecting the presence of a mass imbalance in addition to correctly detecting the appropriate severity of the damage state. Strain gages at each blade root for blade root axial force measurements were used to detect mass imbalance. The mass imbalance damage state classifications were used for each FAST simulation and inflow condition. If the measurement at a given wind speed, profile, and damage state met the criteria described in the table above, then it was deemed a success. Otherwise, it was deemed a failure. For example, the blade root axial force was extracted from the simulation for the 3.88 m/s laminar wind profile and for a turbine with a blade which had a G16 mass imbalance. If the blade root axial force difference was greater than 950 N and less than 2,300 N, then the detection was a success and given a “1” value at that data point. If it did not meet the criteria, it was given a “0” value. The number of successes was then added up and that total was divided by the total number of simulations in that wind profile (101 simulations). The resultant percentage was the probability of detection for that damage state and wind profile. For states 2 through 4, the POD (Probability of damage) was calculated for the probability that the presence of damage was detected in addition to the classification for that damage class, respectively.
 Table 2 shows the POD values for detecting the presence of a mass imbalance and then categorizing the damage into each damage case. The PODs were calculated over the entire wind speed range from cut-in to cut-out (3 to 25 m/s). In addition, an enhanced wind speed range (e.g., 11.4 to 25 m/s in the case of mass imbalance) was determined that optimizes the resulting detection probability values for accurate damage detection for all wind loading cases. In other words, the measurements, algorithms, and probability of detection calculations are only done within the wind speed range defined in the tables below. For mass imbalance, the detection strategy was 100% successful in the optimized wind speed range for all wind profiles.
Work is ongoing to incorporate additional degrees-of-freedom into this analysis. In addition, a cost analysis is in development to quantify the potential operations and maintenance cost savings with the use of such a SHPM system.
Sandia National Lab
D. Todd Griffith, (505) 845-2056
sandia.gov
Filed Under: Blades, News


