For wind farm operators, monitoring a wind turbine’s (WT) individual energy production is the basis of any business control strategy. As the basis, this is only the tip of the iceberg because it is affected by multiple factors and some of them impossible to change, such as environmental conditions or location.
The colored traces below show how the accumulated energy for all turbine’s in the study (on one warm) progressed during 2013. The energy generated depends, of course, on the wind speed and the availability of the turbine. The block chart (below) is a heat map of the time based availability and the average wind speed measured at each WT during 2013 for this wind farm. As an example, the steeper slope of March and December is explained by the high availability and wind speed registered that month in general for most of the wind turbines marked in both figures with green outlines.
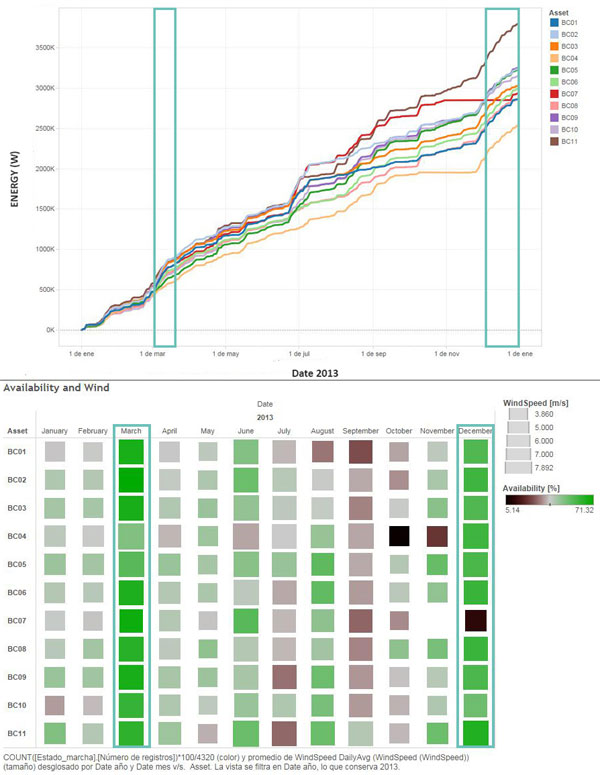
Figure 1 (Top) Monthly accumulated energy production per wind turbine of a wind farm. Figure 2 (Bottom) Heat map of Wind Speed vs Availability (year 2013).
There are factors such as the health of each individual component of the wind turbine that can be monitored using data-driven modelling techniques. A.U.R.A. monitors the performance of each wind turbine and its component’s health. The objective of this article is to explain two real cases where A.U.R.A. has anticipated a degradation of a component with a clear impact in the availability of the wind turbine.
The first case occurred in WT BC01: Thanks to data-driven model based technology, A.U.R.A. detected failure symptoms ten months in advance (early in October of 2012) as can be seen in Figure 3. Consequently, the WT BC01 suffered a corrective maintenance intervention the 26th of June in which the rotatory joint of the gearbox was replaced.
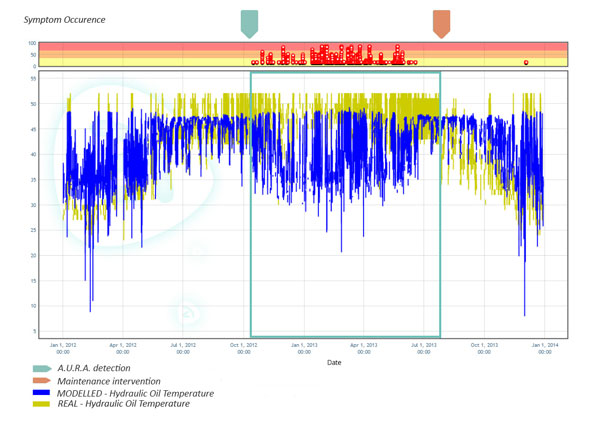
Figure 3 WT BC01 – A.U.R.A. generated failure symptoms based on hydraulic oil temperature behavior.
The second case occurred in WT BC04: A.U.R.A. detected abnormal behavior in the gearbox oil temperature one month in advance (in early February 2012) as Figure 4 shows. In this case, the failure caused a dramatic downtime because the maintenance work order was executed once the wind turbine alarms occurred. At the top of the graph, the wind turbine alarms’ are represented. This helps us to visualize how the technology implemented in A.U.R.A. is able to shift the maintenance planning from “alarm based” to one based on real equipment health condition, and therefore, minimize the consequent downtime.
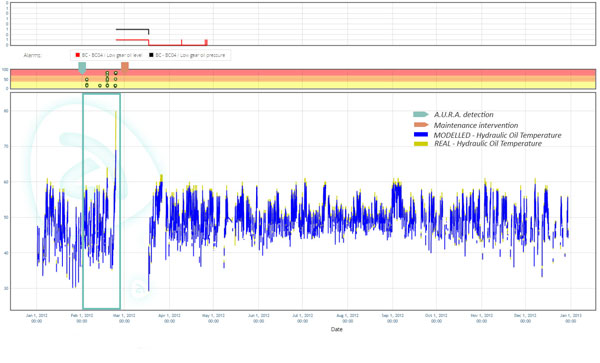
Figure 4 WT BC04 – A.U.R.A. generated failure symptoms based on gearbox oil temperature behavior.
To complement the previous figure, Figure 5 shows the heat map of the time based availability and the energy measured in each WT for this wind farm. According to the results, a very low availability is measured during March due to the failure predicted by A.U.R.A.
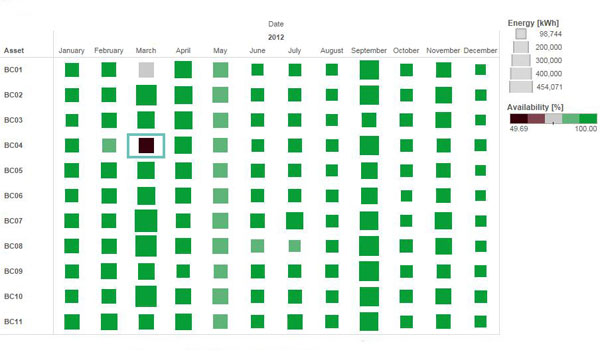
Figure 5 Heat map of Wind Speed vs Availability (year 2012).
In conclusion, a strategy based only on energy produced and availability monitoring is a partial approach. It must be complemented with a wind turbine’s main components’ health monitoring platform to make a root cause analysis possible as well as to optimize the maintenance planning.
Filed Under: News, Turbines


