The Clean Energy Patent Growth Index (CEPGI), published quarterly by the Cleantech Group at Heslin Rothenberg Farley & Mesiti P.C., provides an indication of the trend of innovative activity in the Clean Energy sector from 2002 to the present. Results from the third quarter of 2013 reveal the CEPGI to have a value of 757 granted U.S. patents, a figure lower by 8 than the previous quarter and lower by 41 one year prior. GM was granted the highest number of clean energy patents for the third quarter, taking the quarterly lead back from Toyota. Solar patents again led the other technology sectors for the second quarter in a row after topping Fuel Cell patents for the first time the previous quarter.
 The granting of patents by the United States Patent and Trademark Office (PTO) is often cited as a measure of the inventive activity and evidence of the effectiveness of research & development investments. Patents are considered an indicator because a patent requires the efforts of inventors to develop new and non-obvious innovations along with the successful handling by patent counsel to shepherd a patent application through the PTO. Thus, granting a patent is an indicator that efforts at innovation have been successful and that the innovation had enough perceived value to justify the time and expense in procuring the patent.
The CEPGI tracks the granting of U.S. patents for the following sub-components: Solar, Wind, Hybrid/Electric Vehicles, Fuel Cells, Hydroelectric, Tidal/Wave, Geothermal, Biomass/Biofuels and Other Clean Renewable Energy.
Click here to view the image.
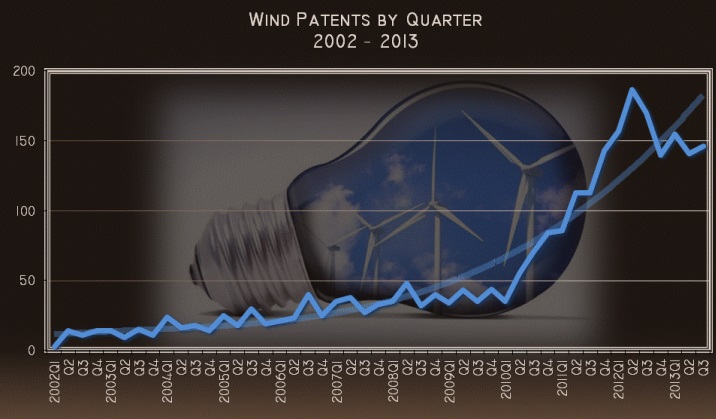
Solar patents fell 21 (225) from the second quarter but again topped Fuel Cell patents (195) to put the nail in the coffin of the longtime leader which had been the leading technology sector in the CEPGI – back to 2002 – before being toppled by Solar patents in the second quarter. Solar patents were up 3 compared to a year prior. Fuel Cells still lead Wind patents (146) in the third quarter by 51 patents, after dropping 14 patents from the second quarter and 87 from a year prior. Wind dropped 5 relative to the second quarter and 24 compared to a year prior.
Hybrid-Electric Vehicle patents was a big winner in the third quarter – up 14 to 108 patents granted and up 27 compared to the same time period in 2012. Tidal patents dropped 7 to 15 relative to the second quarter and were up 4 compared to a year prior. Biofuel and Biomass patents had the biggest jump of the various technologies with 17 more patents than the previous quarter at 64 which is the most quarterly patents for this sector since tracking of the CEPGI began in 2002. Biofuel and Biomass patents were also up 25 versus the third quarter of 2012. Geothermal patents were down five compared to the second quarter and down one versus a year ago. Other Alternative Energy patents jumped seven to 16 and were up five over the year before.
Seesawing back and forth, GM had 40 clean energy patents and retook the quarterly clean energy patent crown from Toyota (327) which had taken the quarterly crown from GM the quarter before. Hyundai (31) also topped Toyota in the third quarter coming in second to GM. Fuel Cells (25) and Hybrid and Electric Vehicle patents (13) led the way for GM which also uncharacteristically had two patents in Solar technologies. Hyundai had 17 Fuel Cell and 14 HEV patents, along with a Solar patent. Toyota (27) also split its patents between Fuel Cells (20) and Hybrid and Electric Vehicle patents (8). Samsung tied Toyota in quarterly clean energy patents with the most Solar patents among the leaders at 6 and also had 18 Fuel Cell patents granted. Mitsubishi (25) and GE (21) were four clean energy patent apart and not surprisingly led the others in Wind patents with Mitsubishi edging out GE by a 19 to 16 margin. GE and Mitsubishi also both had HEV and Solar patents with Mitsubishi leading GE 3 to 1 in HEV patents while GE led its rival by the same ratio in Solar patents. Honda had 9 Fuel Cell, 6 Hybrid and Electric Vehicle, and 2 Biomass and Biofuel patents while Ford trailed Honda by one clean-energy patent having 13 HEV and 3 Fuel Cell patents. Nissan and Kia tied with 12 clean energy patents with Kia having 6 each of Fuel Cell and HEV patents while Nissan had 8 and 4 of each respectively. It is interesting to note that if Kia’s total was combined with that of Hyundai, given their corporate ties, the combined total would top all others in the third quarter.
Also, as mentioned previously, it is interesting that despite there being more solar patents granted in the third quarter than the other technologies, among the top ten clean energy patent grantees, Fuel Cells and Hybrid and Electric Vehicle patents vastly outperformed Solar with Fuel Cells topping Solar by over eight times, at 107 to 13, suggesting that the large patent grantees are not driving the explosion in Solar patents, and instead smaller patent grantees are driving this trend.
Japan led non-U.S. holders of U.S. Clean Energy patents and individual U.S. states, as depicted below in the geographic charts, and had 151 patents in clean energy, up four from the previous quarter and down 61 from the same period a year prior. Japan again took the quarterly geographical Clean Energy patent crown over runner up California (70), which was down 16 from the previous quarter and down 13 from the third quarter of 2012. Korea (69) took third place switching spots with fourth place Michigan (61). Korea jumped 18 patents compared to last quarter and was up 15 over a year ago. Michigan fell 11 versus the second quarter but was up 11 from the third quarter of 2012.
Germany (55) again topped New York (34) and Taiwan (31) in clean energy patents, but by a bigger (over 20) margin than last quarter. Germany regained its patent footing, up 16 from the second quarter, and lost one compared to the same time period a year before. New York fell one compared to the previous quarter but was down 29 versus a year ago. Taiwan also fell 4 versus the second quarter of this year and one compared to the third quarter of 2012. Massachusetts (18) switched spots with its cross-country rival Texas (16) and led Denmark (15), Spain (14), China (13), New Jersey (12), Illinois (12), Ohio (11), France (10) and Switzerland (10) in clean energy patents in the third quarter of 2013. Downloadable copy of this post with all graphs.
Clean Energy Patent Growth Index
Cepgi.org
Filed Under: News


It would appear that the Clean Energy Patent Growth Index is inaccurate, or at least incomplete, in the count of # of patents issued in wind. In 2013, 729 US patents were granted vs. 834 in 2012. There were 191 wind turbine related patents issued in Q4 2013, with Siemens at 24, Vestas at 18, GE at 18, and Mitsubishi at 12. The net result of Siemens taking the top spot in Q4 was for them to overtake Vestas as #2 in overall global patent filings as well as #2 in US patent filings.
The reason for the spike in 2012 was predominantly due to GE taking advantage of the “Green Patent Fast Track” in the US. Now that the pilot program has been exhausted, GE has shifted their filing protocols to more PCT applications than in the past.
Also, to only look at the US jurisdiction would present a skewed view of the results since a majority of the patent filings related to recent R&D trends will originate in Europe and the US national phase of the patent application will not publish until 18 – 30 months after the date of filing, depending on which filing protocol was used.
Deeper review of the data is often necessary to infer trends in filing pace / protocol as well as technology. This stands in stark contrast to layering inadequate analytics tools onto data obtained from the patent office with no human interaction or review involved.