This article comes from Platts McGraw Hill Financial and is authored by Kassia Micek
To date, wind output has averaged 6,875 MW in March, up 3,800 MW from the March 2015 average of 3,075 MW.
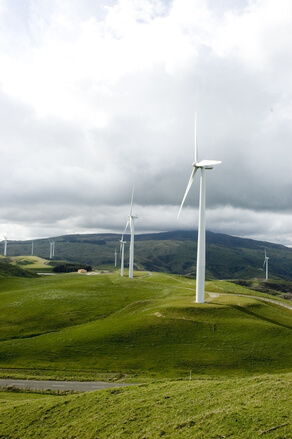
The share of wind in the U.S. Southwest Power Pool set a record in early March at 45.1%, surpassing a record set the previous day, a spokesman said. The record was set shortly after 1 am CST Monday as wind peaked at 9,450 MW and load level was around 20,960 MW, SPP spokesman Derek Wingfield said.
That record broke one set less than 24 hours earlier when the share of wind in the power mix was 44.8% around 1:50 am Sunday as wind generation reached 9,715 MW and total load was around 21,700 MW, Wingfield said. SPP has set six records in 2016. To date, wind output has averaged 6,875 MW in March, up 3,800 MW from the March 2015 average of 3,075 MW. February wind output averaged 5,800 MW, up 2,225 MW versus February 2015, while January wind output averaged 4,350 MW, up 975 MW from last January.
The increased wind is caused by the El Nino weather pattern, said Matt Rogers, Commodity Weather Group president and meteorologist.
“It tends to increase wind patterns across the Plains states,” Rogers said. “It does seem like this pattern will persist into March and April.”
The El Nino weather pattern will start to die off as summer begins. “El Nino remains strong, with continued warmth in the surface waters of the east-central tropical Pacific and wind and rainfall disruptions across the entire basin,” the National Oceanic and Atmospheric Administration said. “Most indicators are starting to show weakening; however. El Nino is likely to become neutral by late spring or early summer 2016, with a possible shift to La Nina in the fall.”
When the record was set Monday morning, coal-fired generation made up about 36% of the fuel mix, natural gas accounted for roughly 12% and nuclear around 11%, with diesel fuel oil, hydro and solar and less each than 1%, Wingfield said.
Wind-powered generation accounted for about 13.5% of the fuel mix in 2015, Wingfield said previously.
SPP North Hub off-peak real-time locational marginal prices averaged about negative $4.25/MWh Sunday and averaged negative $12.75/MWh as of 10 am CST Monday. SPP South Hub off-peak real-time LMP averaged $18.25/MWh Sunday and about $4.25/MWh as of 9:45 am Monday.
Total installed and available wind capacity in SPP is 12,397 MW, Wingfield said previously.
As of the end of last year, SPP had 33,819 MW of wind capacity in development, including projects under study, those with executed interconnection agreements and those under construction, he added.
Filed Under: News


