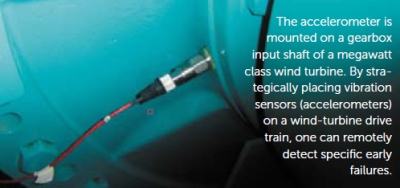
A small vibration transducer attached to a wind turbine changes the way owners and manufacturers approach maintenance. These sensors, called accelerometers, output millivolt signals proportional to their acceleration vibration.  They have a sensitivity range that matches the expected operating conditions in the turbine. Each component in a wind turbine vibrates at a different frequency, letting accelerometers detect those individual frequencies. An increase in a particular frequency usually indicates a failing component. The higher the amplitude of that frequency, the greater the damage at that location. Let’s walk through an example on a megawatt class wind-turbine gearbox.
In the trend traces below, it is obvious that one turbine is trending much higher in vibration than the other. The accelerometer’s signal feeds into condition monitoring hardware and ultimately into vibration analysis software to view the trends.
The gear mesh frequency, fgm, may be the easiest example to explain. It is a vibration signal that comes from two gears in mesh. This is easy to see in the equation:
fgm = ωNt
where ω = rotation speed, rpm; and Nt = number of gear teeth.
Different tooth counts appear in different locations on the vibration spectrum. The higher the peak (amplitude) of the frequency, the greater the damage at that gear union. A bearing’s math is somewhat similar in that the number of rolling elements, a rotation speed, and a diameter figure into a bearing’s signature. Moving to the generator, its equation would be:
fgen = ωNrb
where fgen = frequency from the generator, and Nrb = number of rotor bars
Good vibration-analysis software will crunch the numbers, but this gives a rough understanding of the process. This is greatly simplified (especially for planetary gear meshing) but it indicates how these specific frequencies are derived.
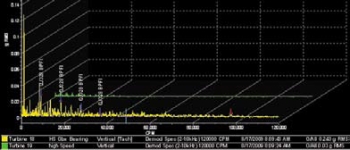
 The vibration spectrum comparison below shows results from a few useful calculations. First, look at the summation of all of the vibrations in the signature. This is called the overall vibration and appears in the chart on the lower right in units of g RMS. Note the differences between the overall vibration measurements of these two turbines. One has a vibration level of 0.03 gs while the other has a measurement that is almost 10 times higher.

There are three bearings on the gearbox’s high-speed (HS) output shaft. The vibration spectrum has labeled a particular bearing part number, QJ328 in this case, and the subcomponent, the inner race. It is labeled BPFI for ball pass frequency, inner race. This indicates damage likely to this one bearing component. The four labels are harmonics of that bearing and subcomponent.
A second detail to notice are the two vibration signatures. One simply looks like it is vibrating more than the other. And it is, again 10 times the amount of vibration than the other turbine and at a location on the high-speed (HS) shaft.
The last trace features to notice are the repeated peaks in the yellow vibration signature. The peaks are non-synchronous to running speed, and there are repeated harmonics. This indicates a bearing issue. The harmonic peaks are labeled by the vibration-analysis software with the actual bearing number and its subcomponent. In this case, BPFI is for ball pass frequencies, inner race.
Here’s where this analysis gets interesting. The gearbox manufacturer would say this is an up-tower repair and at such an early stage of damage, will cost $10,000 to $15,000 to fix. If the component is left to fail, the resulting repair escalates to an estimated $260,000. How is this possible to remotely detect early damage with such high-cost avoidance? Those little accelerometers are key.
As a turbine owner, you would be concerned with which of the three bearings are damaged because you would need to know which of the three bearings to order, stock, and send up-tower. Are you concerned with the subcomponent, such as the inner bearing race? Not likely, unless it is failing on a population of turbines indicating another issue altogether. That could be attributed to incorrect installation, fitment, poor quality, or several other problems one would find in a bearing or component autopsy. Would you be glad to have this much lead time to repair the damage and save $245,000? Probably.
This is the power of vibration analysis. Without being on site, one can determine that a turbine has not only a high-speed shaft bearing failing, but that it’s the inner race of the bearing and at an early stage of failure. This provides time to plan for the repair rather than to react to a catastrophic failure.
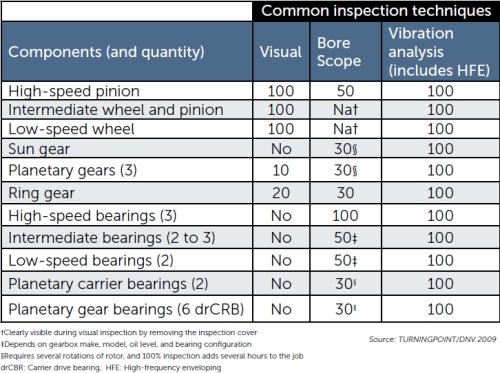
Condition monitoring using vibration analysis hardware and software is increasingly gaining use in wind turbines. The main reason is because more recent turbines are larger so associated repair costs are also greater than on smaller units. The other reason is that detection is much more effective over other primary inspection methods, such as bore scope and open inspections. These methods require a climb and a technician in the nacelle. Vibration analysis requires no one to be on-site and detects a higher percentage of gearbox problems than other methods. Also, vibration analysis looks beyond the gearbox and detects failures in the generator and main bearing. But that’s another article.
Filed Under: Nacelle, Safety, Sensors


Thanks for the response, Paul. I’m still looking for more data on both condition monitoring methods.
In researching both methods, I’m getting the impression tuned sensors for both acoustic and vibration monitoring extract data in very similar ways. Both systems perform a FFT on the wave signals, and look at the frequency response of the output. Granted, there is an algorithm used to quantify the amplitutde/severity of the signal and match it to a known error-type. Beyond that, the analysis seems to be based on historical evidence of “guess-and-check” acquired through experience.
I have some experience with partial discharge testing on buried cables. Vibration monitoring and acoustic monitoring both appear comparable with each other, and eerily similar to PD testing.
If anyone has further data on either method of condition monitoring, I would appreciate a heads-up. Are there any Acountical or Mechanical Engineers who would like to comment?
Thanks!
Thanks
How does vibration monitoring compare to acoustic monitoring? Is one method more reliable than the other? Which has greater market share?
Scott:
I suspect (no proof) that vibration monitoring has the larger share of the market, probably because it has been in development longer. Vibration is a sort of known language and it’s quite detailed– able to pinpoint most any mechanical problem. Acoustic monitoring would need the algorithms to interpret what it’s listening to.
Paul
Vibrations are not just a mere small thing, but an important aspect in keeping an eye on your equipments.