José Luis Nuño Martos / Performance & Reliability Engineer / Abilene, TX
Two significant features make Weibull Analysis a powerful tool. For one, a small number of samples can provide a failure analysis and failure forecast with a prescribed confidence interval. And the simple graphical way it typically presents failure data is extremely instructive.
Waloddi Weibull invented the Weibull distribution in 1937 and delivered a seminal paper on the topic in 1951 [1]. In it, he claimed the distribution could be applied to a wide range of problems. Since then, it has been recognized as a leading method for fitting and analyzing life data. A case history will show that even in its simplest form, Weibull Analysis can add significant value to an engineering problem.
The basics
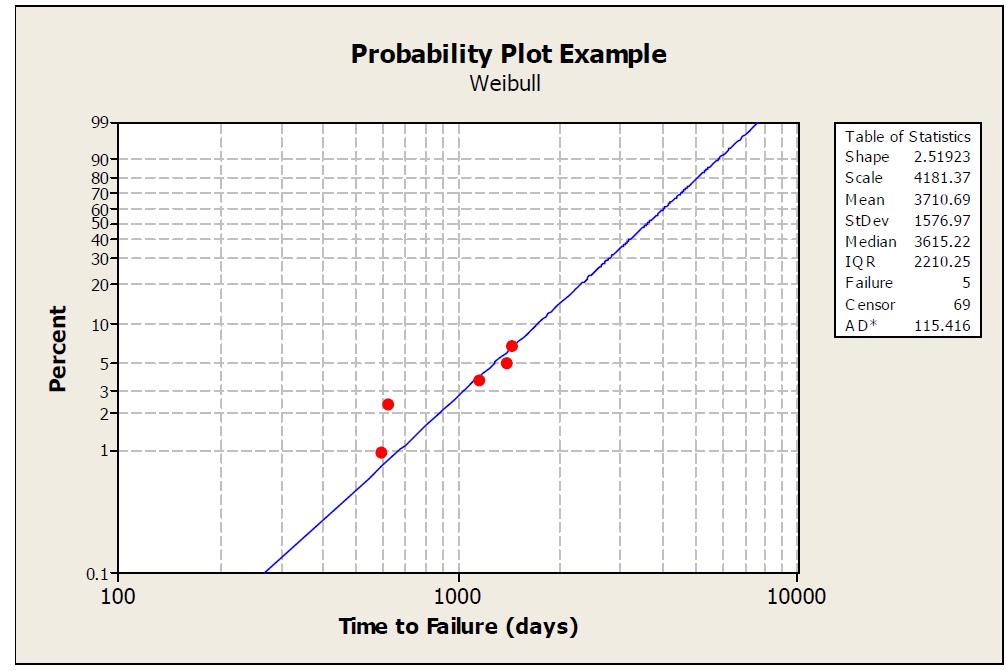
The simplest form of Weibull Analysis consists of plotting ranked time-to-failure, or cycles-to-failure, data on special Weibull paper and then interpreting the plot. Good quality data allows fitting a straight line to the data and extracting the slope or Shape Factor ß. The other key parameter readily available is the Characteristic Life, or Scale Factor, η. It is the time or number of cycles at the 63.2 percentile of the distribution. The Probability plot example leverages the power of Minitab statistical software [2] (minitab.com) to fit a line to a data set and generate key statistics.

An example of a Weibull plot shows that even a few data points of failures are enough for meaningful results.
In this case, a Shape Factor ß of about 2.5 and a Scale Factor ƞ of about 4,181 days. A shape factor greater than 1 suggests wear out. The expected life is 20 years, and yet the Characteristic Life is less than 12 years, so the wear out is deemed premature.
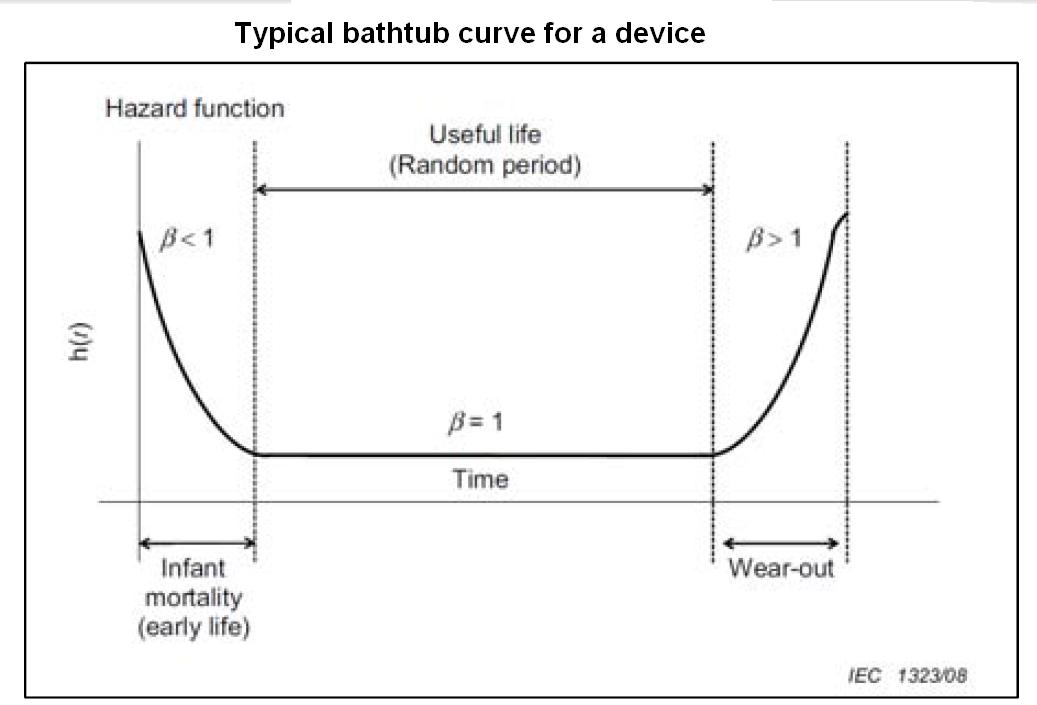
The Typical bathtub curve for a device shows a typical shape [3]. The figure highlights the relationship between the Weibull Shape Parameter, ß, and the Hazard Function. The Hazard Function, h(t), represents the probability of an event “failure” in an interval of time, given that the component or device has survived up to that time. Physically, it is an indication of the risk to a part at any time t. For example, an increasing failure rate means that as the part ages or survives longer, it has a higher chance of failing in the next time step. This is similar to the process of human aging, where a person’s chances of dying in the next year increase with age [4]. A ß <1 implies infant mortality, ß=1 implies a random failure, consistent with a normal design life, and ß >1 implies the device will wear out, or reach an expected end of life.
A case history from a wind park
In this wind park, the electrical collection system was originally built with 18 underground splice pits where lengths of power cables were spliced together to connect turbines to the substation. Between May 2011 and June 2012, five underground splice pits were excavated to repair cable splice failures. The total energy loss from these incidents was 5,700 MWh, plus the expense of repair, about $23,000 each.
The Plan-Do-Check Act (PDCA) method was used to tackle the issue. A common understanding of the facts was developed with a problem statement including the most important affected Key Performance Indicators: this problem contributed to 15% of the station Equipment Equivalent Forced Outage Factor for 2012.
The Team recognized that, due to the nature and complexity of the cable failure, external consulting assistance was needed to complete a Root Cause Analysis. Cable Technology Laboratories in New Brunswick, NJ was commissioned to provide its expert opinion. The lab concluded that the failure was due to improper joint assembly.

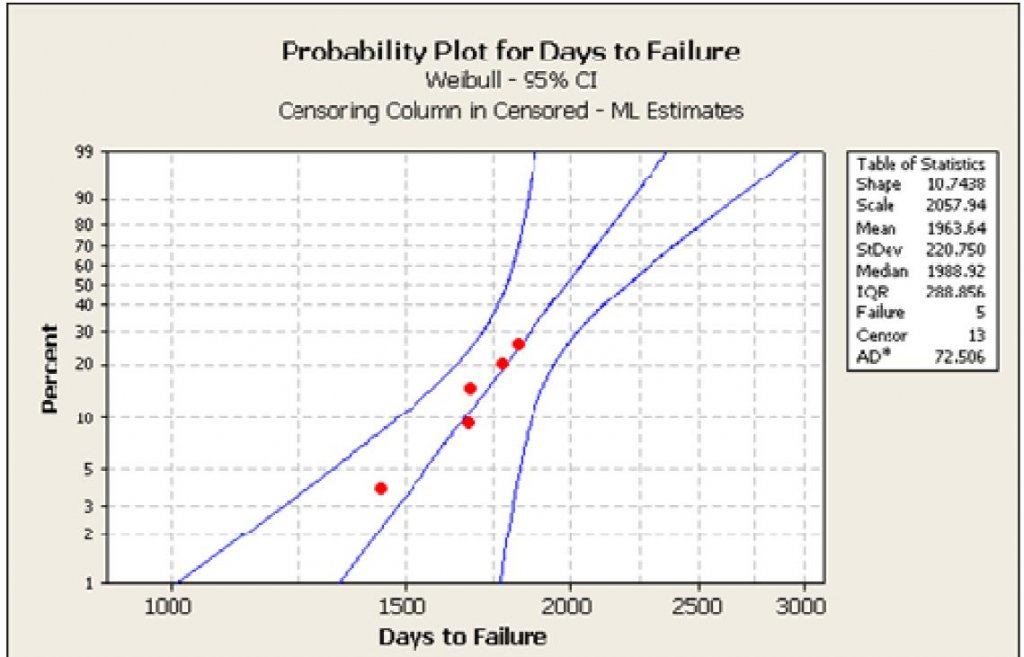
The five splice failures provided data to generate this Weibull plot and with 95% confidence interval for further splice pit failures
With another 13 splice pits containing similarly spliced cables the question was: “What can we expect in the near future?” To address this question, Weibull Analysis was used to predict the expected life of the remaining splice pits by fitting a statistical distribution to the failure data. Key parameters derived from this curve fit were used to project the number of failures that could be expected in the future, assuming the splices would be replaced or renewed with identical splices. Probability plot for days to failure shows the five failures (red dots) on a probability plot. The slope was severe enough to suggest that three cycles of failure could be expected within the next 15 years, as highlighted in Estimate of annual replacements with renewals if replacement in kind continued.
The combined use of the PDCA method and Weibull tool, along with a financial analysis, established a clear justification for the project and the impact over time. The total cost over the project life, if nothing new was done and splices were simply repaired with an identical splice, was projected up to $4,800,000. This prompted the site to accept the consultant’s recommendation to eliminate the underground splices by proactively replacing them with above ground junction boxes which are expected to remove the path to failure experienced by the underground cables and allow for periodic inspection. Due to the magnitude of the project (investment and downtime) a three-year implementation plan was developed to eliminate all underground splices at the site. With the high total cost of replacing the splices using the same type of connection, mentioned above, and implementation cost of about $400,000 for the junction box solution, a pre-tax NPV of $1,700,000 was calculated with an associated pre-tax IRR of 190%.
The Weibull Analysis predicted additional failures were imminent and the prediction appears to have been validated because, during the replacement process five of the 10 splice pits replaced in 2012 showed clear evidence of imminent failures, as evidenced by discovery of degraded cables, such as the one shown in the photo. No further in-service failures have occurred.
Final thoughts
Weibull analysis is a powerful technique easily leveraged across the wind sector to develop a better understanding of the life-cycle costs of failures and thus motivate a change in response from replacing with the same, in an effort to seek out a better long-term solution. These analyses have been used for years in cutting edge industries, such as aerospace and automotive. There are also many examples in literature related to thermal plants, and more sophisticated calculations are possible addressing optimal replacement times. WPE
Filed Under: News, Software


