Electric utilities, energy companies, and wind-farm operators will say that adverse weather can cost their operations a significant amount when it affects their infrastructure. Lightning is one weather phenomena that challenges wind-farm operations. Fortunately, recent products and software allow operators to proactively plan for lightning, and reduce the uncertainty of turbine underperformance. Before discussing lightning-data products and software, it is important to know how lightning affects electric operations and why it is critical to verify its occurrence.

The red plot on a turbine-power curve tells that the turbine in its ramp section is underperforming compared to the wind project average (black). Is lightning the cause of the underperformance?
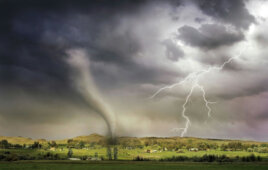
Lightning strikes to wind-turbine generators cause significant damage each year. Blades are particularly vulnerable, leading to turbine and wind projects underperformance. Lightning also increases the risk of future turbine component failure due to residual affects that may take a turbine offline for an extensive period. Thus, it is important that operators quickly identify turbines that have suffered a strike to reduce the probability of further losses and damage.
Inspecting each turbine on a large wind farm would take too much time and effort due to the sheer number installed. But knowing the location (±150 meters), timing (time stamp), and strength (peak current) of a lightning strike greatly eases underperformance investigations and shortens repair time. Additionally, this information can serve as critical evidence with regard to replacement warranty parts.
Software can help operators verify and locate recent and historical lightning events, which they can then correlate with the damaged assets. A program called Fault Analysis and Lightning Location System (FALLS), developed by Vaisala, lets utilities and wind farm operators analyze lightning events in near-real time and access historical lightning data for analyzing past exposure of wind farms and transmission assets to lightning.
FALLS software has three main applications: asset-exposure studies, asset-reliability studies, and lightning-strike density studies. A particular focus depends on the kind of data an operation is looking for. Asset exposure studies are used to overlay infrastructure with the correlative lightning activity when the exact time of the damage is unknown. It is used proactively to determine which generators had the highest risk or potential of being affected during a recent storm. Operators don’t want to find out months or even years later that their power generation has been reduced due to lightning–they want to know right away. In the U.S., the software uses lightning data from the National Lightning Detection Network (NLDN), owned and operated by Vaisala. The NLDN can provide the current intensity of a lightning event, its duration, timing to the millisecond, and a median location accuracy better than 250m. This data can greatly increase chances of determining exactly which turbines were affected and how critical the damage may be.

The density study map was generated by the NLDN network.
Asset-reliability studies are used for event-specific lightning analysis in near real-time. These two FALLS studies let operators locate poorly performing turbines, validate lightning protection design, and correlate faults to lightning activity (or a lack of lightning activity). The IEC standard for wind-turbine lightning protection of wind turbines assumes that all strokes in a collection area strike a wind turbine. The collection area is a circle centered on the turbine with a radius equal to three times the tip height. Data from FALLS can help determine when a damage event occurred, as well as which stroke best matches the fault timing, and which stroke had the highest peak current event, likely causing the most damage. The software lets operators more accurately pin-point which turbines are affected, thereby improving the overall efficiency of the operation.

Lightning data from FALLS software indicates strength and location of strokes.
Density studies are used to access the history of a site’s exposure to lightning. This may be where an analysis of “hot spots” is needed for lightning activity in or around a wind farm, say over a three to five-year period. Accessing historical lightning data, the software lets users conduct an investment study and determine the lightning density per square kilometer within the area of interest. The software displays the lightning events on a map by date, kA (strength in kilo-amperes) or discrimination (lightning type and polarity) to more easily view the data. This lets users better plan for the vulnerability of turbines and know the areas with the highest concentration of lightning.
There is no way to avoid lightning strikes to a wind turbine. There are, however, ways to quickly determine whether or not lightning was the cause of a problem, and react accordingly to best manage the situation. Tools, such as lightning software, and networks such as NLDN, help verify and plan for lightning strikes so that electric utilities and wind-farm operators can efficiently continue to offer cost-effective and reliable renewable power. WPE
 By: Melanie Scott, Meteorologist at Vaisala www.vaisala.com
Filed Under: Featured, Software