BEFORE WIND PROJECTS ARE BROUGHT OR SOLD, analysts familiar with such facilities often write 30
to 50 page reports – wind-resource assessments – on how they see the facility working. Frequently, there is more value in the report than one might imagine, information that might explain the difference between predicted production and actual output. That was the message from independent consultant Amit Bohara at the recent Wind Operator Congress. Bohara previously spent five years with DNV GL and GLGH supporting analysis on more than 50 projects.
Depending on the risk tolerance of the financing entity, a loan is set at one of these P levels.
“The wind-resource assessment report makes a lot of sense before sanctioning a buy,” says Bohara. “But if you’re managing the site, is there something else useful in the report? Yes. Sometimes it may be the estimates, such as the expected energy output of the site. Other times, the estimates of expected wind speed variability or availability can serve as a benchmark to help evaluate how the project is actually doing.”
Other questions the report might answer are: How much curtailment related downtime has the project experienced? Are the turbines working properly? This latter question may be answered by a close scrutiny of turbine power curves, and can help detect cases where the turbine was not operating optimally due to pitch
and yaw issues or incorrect control setting. “Another interesting situation arises after building an extension to a project. It would be useful to know ahead of time how Phase 2 might decrease Phase 1 production,” he says.
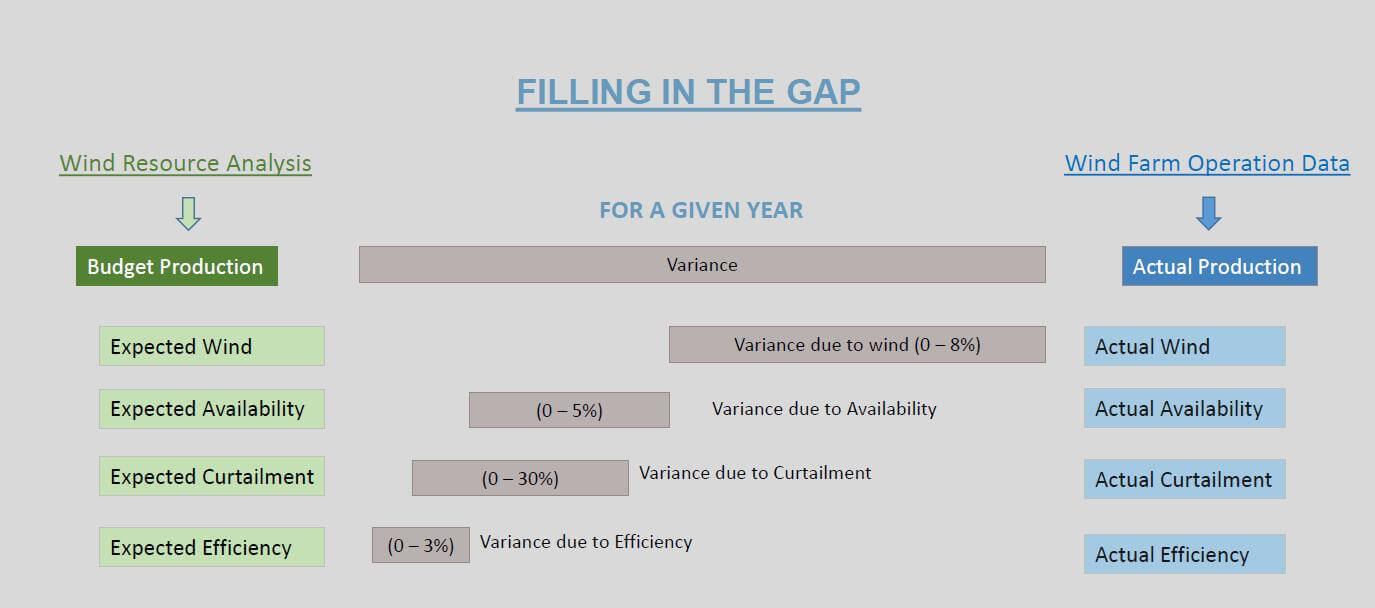
There will always be a difference between expected and actual production. But where does the variation, the gap, come from? A reasonable place to start is to compare production to the pre-construction estimates because that, to some degree, is what the financing is based on.
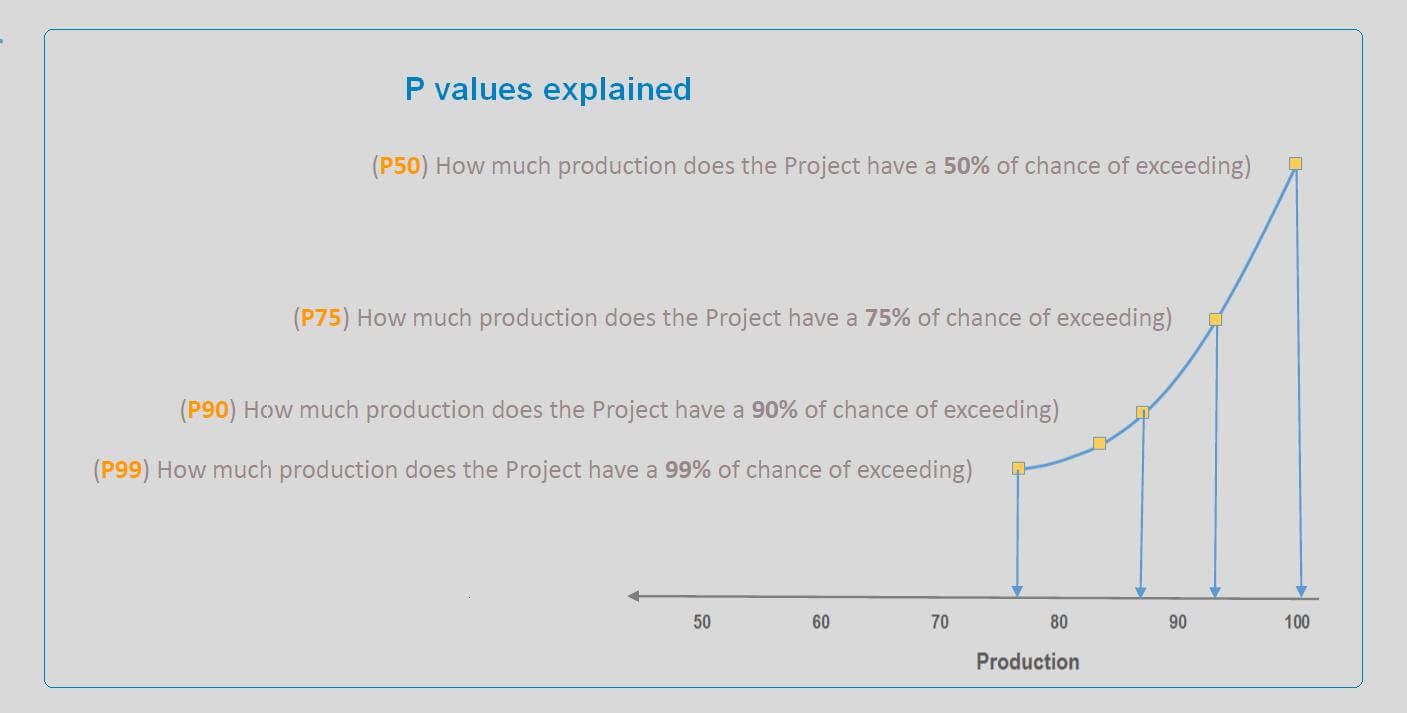
“Assume we have a site selected along with a general layout. What can the site produce? It’s a tricky question because there is no one answer. The answers always come in a range. So a better way to phrase the question is: How much production does this project have a 50% chance of reaching? Now you’re not asking for what the site exactly produces, but what can it at least achieve at some probability level. That is the P50 figure. It is the production a wind-resource assessment thinks you have a 50% chance of achieving,” Bohara said.
“For example, suppose a P50 value for a 100 MW wind-farm says production will be about 100 MW. “The number
means that the analysis estimates that the Project has a 50% change of exceeding 100 MW of annual production over the long term. A P75 number could be around 94 or 95 MW, and so on. A P99 figure might say with great certainty, production will be at least 75 MW. The P-numbers provide a range of values and the different probabilities of exceeding them,” said Bohara.
The expected production level derived from an energy assessment analysis takes many factors into considerationl.
However, there are about four independent contributing factors. First, the most important factor affecting the project production is the site’s wind levels. Second, the expected availability – how often the project is available to produce energy. It is important to consider the effects of both the turbine component failure as well as downtime that may result from the balance of plant and environmental factors. Third, there may be curtailment imposed on the project that leads to energy losses. The impact of curtailment can be minimized if there is a compensation
structure in place.
Fourthly, turbine efficiency. There are two aspects to it. “One is what the manufacturer says in the power curve,
which can be tested with a power performance test. The other is efficiency losses that can result from operational
issues such as icing , derating, blade degradation, and so on,” said Bohara.
A wind-resource analysis should give a good starting estimate for how much the wind can change in your particular
place. Some of such numbers range from 5 to 6% from year to year, on average. “The second thing to notice is how
much of the variance is coming from availability. I have seen somewhere in the 1 to 5% range,” he said.
Curtailment is an interesting issue because it appears as downtime or a se-rating, depending on the kind of
curtailment at a site. When more than 5% of a site’s annual time is due to curtailment, do a more detailed study. “If you think you’re annually losing 10 gigawatt-hours, the figure could easily be closer to 60. The science of wind flow is different when things are curtailed at a massive level, such as an entire wind farm,” he said.
Lastly, efficiency needs a close look. “When completing a wind-resource analysis, assume you’re going to work
with SCADA data, the turbine power curve, and maybe with adjustments for different degradations,” he said.
For example, examining SCADA data may reveal icing losses in the winter, or someone de-rated the turbine and forgot to turn it back up. Make sure items of this sort are not overlooked.
“Now just a few comments on what can improve an analysis when you’re looking at each of the factors mentioned.
Wind, of course, is the biggest factor. It is the biggest contributor as to why the production may vary so much.
One way to get a better sense of wind resource variation is to look at a nearby meteorological station. For instance,
when there is a met mast on site, it may be “waked” by an onsite turbine and not provide an independent measure of the wind. In such cases, you might compare (the met mast) to a regional weather station or a reanalysis data set such as MERRA, a data set NASA distributes. It’s a neutral source and it’s not affected by the turbine. You might use it as a benchmark to understand for how the wind is changing.
Availability is one thing that everybody is paying attention to. “It’s easy to get caught up in just what the turbine availability is, but you can lose track of where you’re losing energy in other places. There may be downtime resulting from environmental factors such as icing or balance-of-plant outages. When trying to reconcile these things, consider all sources of down time, not just the turbine. If you can, it’s always good to calculate the actual energy loss, not just the time, due to down time,” he said. Reach Bohara at
amitbohara@gmail.com.
Filed Under: Featured