Editor’s note: This article comes from Campbell Scientific, Inc., a provider of dataloggers and data acquisition systems for long-term, unattended monitoring. It is written by Jacob Davis, a Customer Support/Implementation Engineer with the company.

Campbell Scientific’s the 03101-L Wind Sentry Anemometer.
At some point, you may have watched the real-time wind readings from your datalogger and seen the wind speed bouncing back and forth. Then, you probably wondered if it really was that gusty outside. In many cases, what you are seeing is the resolution of the pulse measurement.
In this article, I’ll explain the accuracy and resolution of a pulse measurement, and how resolution affects your real-time readings.
What is the resolution of a pulse measurement?
Note: The resolution of a pulse measurement is the same for all Campbell Scientific dataloggers.
A pulse measurement is a digital measurement, and its resolution is dominated by time. The resolution is one pulse per interval. For a real-time value, the resolution is 1 divided by your scan rate.
When the actual signal frequency is between steps in the resolution, a constant input will result in real-time readings that bounce by a resolution step. If those values are averaged over a longer interval, the new resolution is 1 divided by the averaging interval.
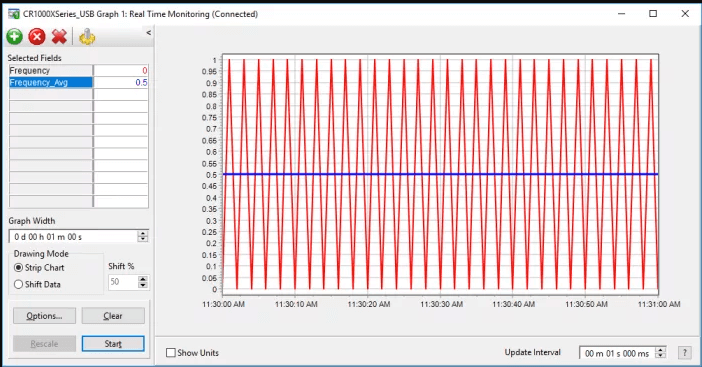
This graph shows how a constant 0.5 Hz signal appears to oscillate when read on a one-second scan rate. The one-minute average of those readings, shown as the blue line, correctly results in 0.5 Hz.
An important thing to notice is that fast scan rates show bigger spikes. Readings performed at scan rates faster than your frequency create very significant resolution errors. To reduce the errors to acceptable limits, average your readings.

Moving the frequency up or down within the resolution step creates a sawtooth wave. This graph shows how a 0.25 Hz signal would appear, read by the same datalogger. A 200.25 Hz signal would be offset but show the same oscillation on top of it.
How does this affect your wind gust readings?
To explain the effect, the 03101-L Wind Sentry Anemometer is used as an example. This anemometer has a multiplier of 0.75 m/s per Hz. So, a 10 Hz resolution error creates an error of 7.5 m/s.
If you were to directly use the raw readings from a 100-millisecond (10 Hz) scan, your maximum wind speed could be over-reported by 7.5 m/s. That is a huge error if your actual wind speed did not exceed 2 m/s. Wind gust is often reported as a maximum three-second average wind speed. The same sensor on a three-second interval has a resolution of 0.25 m/s.
So, if we use the AvgRun() instruction to get a three-second average before taking the maximum, the datalogger might overreport by 0.25 m/s. That is 30 times smaller than the error we were seeing without averaging first.
What is the total accuracy of a pulse measurement?
The total measurement error of a pulse measurement done on a datalogger is the clock error plus the resolution error. The resolution error, as we have seen, is 1 divided by the scan interval. The clock error on a CR1000X is 0.02%. That gives us the specified accuracy of ±(0.02% of reading + 1/scan).
On short time periods, the resolution error dominates. Long-time intervals greatly reduce it. On a daily average, the resolution error will be only 1/86400 Hz.
Takeaway message
With pulse measurements, there is a tradeoff between responsive data displays and resolution errors. On intervals counted in minutes, you probably won’t notice the measurement errors. When you want a real-time data display, you need to carefully consider what time interval to use.
Filed Under: News, Sensors


