At Infigen Energy’s 24/7 Control Center, personnel proactively monitor more than 1,200 turbines. All Operators are NERC and Pennsylvania, New Jersey, Maryland-certified, and undergo more than 100 hours of continued education each year to maintain their certifications.
Turbine technology improvements have significantly increased the production of wind energy over the past 10 years. Even with these improvements, turbines must be properly maintained to meet optimal production and revenue targets.
Today’s turbines rely on complex electronic control systems such as Supervisory Control and Data Acquisition (SCADA) systems. These controls, when coupled with 24/7 monitoring and performance data analytics, provide critical tools that let wind farms meet their estimated Annual Energy Production (AEP).
24/7 monitoring and control center
Real-time monitoring and control are common in most electric power-generation companies and utilities. However, the use of such control centers, staffed by certified operators was not common among early wind-generation facilities. As the number of wind farms increased, the industry addressed the challenge of integrating wind into the larger power grids and recognized the value of optimizing production around the clock. Yet, people are often surprised to learn that many wind farms in the U.S. are still not monitored 24/7 by a North American Electric Reliability Corporation (NERC)-certified control center. These wind farms miss the simple and most effective way to maximize production. Operators at a 24/7 control center can remotely reset most turbines as soon as a fault occurs, which reduces downtime and increases revenue.
The downtime from faults that are reset at a turbine contribute greatly to the industry’s lower availability ratings and AEP results. On the other hand, remotely resetting a turbine after a fault can make a measurable difference to an owner ’s bottom line.
Turbines will fault as a safety mechanism and remove themselves from service for a number of reasons – many are pre-programmed into the SCADA system to protect the equipment. A typical fault for most turbines occurs, for example, when the wind resource shifts directions quickly and the turbine’s yaw system cannot keep up. To protect the equipment, it recognizes that the wind direction is outside a predetermined yaw operating angle, and so controls fault the turbine. Another typical fault of a turbine occurs when the wind resource is such, possibly gusting, that the pitch system can’t perform within the pre-programmed parameters.
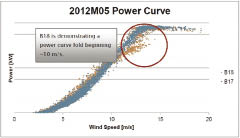
A Power Curve Comparison for a turbine and its neighbors shows performance levels and compares it to site averages.
These yaw and pitch faults are common across a broad sampling of turbines installed in the U.S. These are only two examples of the many that occur on a regular basis during the normal wind-farm operations.
Now the question arises, what happens when a turbine faults and it cannot be reset remotely? This is another reason 24/7 monitoring and control is necessary from a qualified, NERC-certified control center because operational protocols are in place to respond to such an event. If the turbine will not reset as expected, depending on the time of day, a crew is dispatched to investigate and in most cases, performs same-day repairs.
If it is an after-hours event, the problem is reported to an on-call resource. When the crews arrive in the morning, it receives top priority over scheduled-routine maintenance.
24/7 control center payback
A simple analysis of the downtime occurring on the back shift and the available wind speeds, will show that the cost of the 24/7 control center services will pay for itself by keeping the turbines in service 24-hours a day.
One benefit, for example, is if a 2MW turbine is not remotely reset and left offline for 10 hours in windy conditions, the loss of energy production could be as high as 20MWh. The loss of revenue at an energy price of $50/MWhr would equal $1,000. If PTCs are involved, this could add another $500 to that loss. This potential loss of $1,500 for leaving just one turbine offline for just one night more than justifies the cost of 24/7 control center services that costs as little as $1,500 per turbine per year. One remote reset pays for an entire year of monitoring services for the turbine.
Performance data analytics
Routinely performing data analyses using the turbine’s SCADA data provides an additional opportunity to discover losses in production and ensure the wind farm is meeting its AEP. More than 200 data points are collected continuously for each turbine on a typical wind farm. The data, collected on a near real-time basis, annually creates many terabytes of information. The SCADA data is one of the most overlooked resources available to the wind farm.
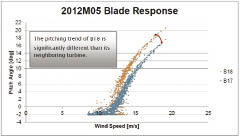
In this Pitch Angle Comparison, turbines B17 and B18 show a significant gap in performance. This identifies the underperforming turbine for next level of investigation.
The data is time stamped and records important information such as wind speed, generator output, and pitch and yaw angles. The key is to know how to harness the data, find the underperforming turbines, resolve all issues, and restore energy production.
An example of routine analysis is represented by a process at Infigen Energy called, Relative Performance Assessment (RPA). This method compares the power curve of a single turbine with the site’s average power curve, and the power curves of its neighboring turbines.
An RPA finds the underperforming turbines. When a turbine is not performing to the site average, it may or may not be a problem because wind farms are large and the turbines do not receive the same wind resource. Comparisons with neighboring turbines, however, determines if further investigation is necessary. When a turbine is not meeting the site average, but performs as well as its neighbors, then a problem may not be present. When it is not performing to the site average and not performing well in comparison with its neighboring turbines, then it is identified as a low-performing turbine.
So what can be done about it? Additional graphs are made using the data to compare the pitch system performance and yaw system performance with the turbine’s neighbors. Usually, one of those comparisons will show a shortcoming in the yaw or pitch systems of the underperforming turbine. This gives technicians an educated path to resolving the issue.
Performance data analytics payback
A simple analysis comparing the underperforming turbine to its neighbor reveals a loss of energy production. If the problem continues, the difference in production and revenue can easily exceeds the cost of the analysis. When such a program is initiated at a site, many problems with under performance are identified and resolved within the first six months. Following that initial clean-up of legacy problems, the service continues to monitor the performance and allows for immediate action when new under-performing problems begin.
Safety
Finally, a critical benefit is increased safety for the wind technicians who have 24/7 monitor and control centers, and performance engineering teams. When a control center is in use, each technician is required to check in with the center prior to performing turbine maintenance.
When the climb is needed, the center safely stops the turbine, and documents the personnel and activities. When the work completes, the technician contacts the center and gives the ‘all clear’ signal. Lastly, the center documents task completion, the safe exit of the technicians, and then restarts the turbine. The process creates a protocol for verification prior to action. Also, access to performance engineering has potential to eliminate unnecessary turbine climbs in an attempt to diagnose the problem. WPE

Judah Moseson, PE CEM
Director – O&M Services
Infigen Energy US
Filed Under: Featured, News


