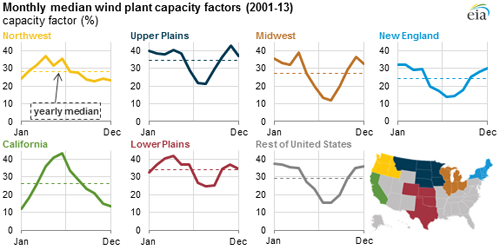
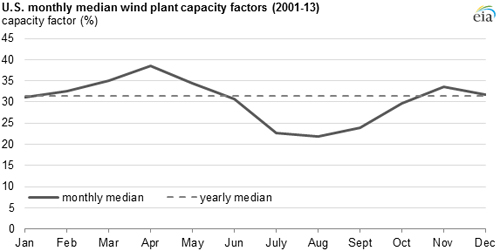
The national wind-plant performance is the highest during spring time, but can vary across regions.
Wind -plant generation performance varies throughout the year as a result of highly seasonal wind patterns. Nationally, wind-plant performance tends to be highest during the spring and lowest during the mid- to late summer, while performance during the winter (November through February) is around the annual median. However, this pattern can vary considerably across regions, mostly based on local atmospheric and geographic conditions.
Unlike conventional fossil-fueled generators, there is no fuel or other variable cost associated with wind power generation. As a result, a wind-plant’s capacity factor—a measure of the plant’s generation as a percentage of its maximum generating capacity—is very closely related to the available wind resource, or average wind speed. In general, wind-plant capacity factors tend to be higher during windier periods of the year.
Because seasonal wind patterns vary by location, seasonal capacity factor patterns also vary across regions. Capacity factors for most regions of the country rise or are flat January through April, fall through August or September, and increase through the remainder of the year.
In California, however, wind capacity factors rise through June and fall from that point through December. Thus, the median winter (November through February) wind-plant capacity factor in California for 2001 to 2013 is about 15%—considerably below California’s annual median capacity factor of 26%. However, during the late summer months when California tends to experience the highest levels of demand (July, August, and September), monthly median wind capacity factors are closer to 30%—above the annual median.
California’s unique seasonal wind performance pattern is a result of a combination of the strong, cold Pacific current on the West Coast, the land-sea breeze effect working with the normal west-to-east winds due the earth’s rotation, and the major wind farms being located in mountain passes relatively near the coast. Wind-plant performance is highly site-specific, and it is influenced not just by wind speed, but also its direction, constancy, and variation by height above ground. These wind characteristics are caused by other atmospheric conditions, primarily temperature differences at different locations.
Performance during winter months tends to be around the annual median for wind plants.
For most of the other regions, the seasonal pattern is reversed: wind-plant performance is highest in the early and later months of the year, not the summer. For example, in New England, the median January capacity factor is about 32%, well above the annual median, while the July capacity factor is closer to 14%, far below the annual median. Although July tends to be the month with the highest electricity demand in the New England region, January also has above-average electricity demand. Wind can be particularly valuable during the winter season when natural gas demand is high—as a direct heating fuel in homes and businesses and as a source for power generation.
Although winter capacity factors tend to be above the average in most regions, the national average was heavily influenced by the larger proportion of plants in California in the early 2000s. As the majority of planned wind capacity additions over the next several years are expected to be in the Upper and Lower Plains regions, the national median capacity factor curve will likely continue to shift toward a slightly higher winter performance.
EIA
www.eia.gov
Filed Under: News


