
3TIER’s second quarter map indicates departures from long-term mean wind speeds that range from -20 to 20% and provides an indication of how wind projects should have performed relative to their long-term production average based on their location.
A renewable energy risk analysis released a wind performance map for the second quarter of 2011. The map illustrates wind speeds above seasonal averages for most of the continental U.S. 3TIER’s second quarter map indicates departures from long-term mean wind speeds that range from -20 to 20% and provides an indication of how wind projects should have performed relative to their long-term production average based on their location. This type of analysis lets financiers and owners perform portfolio analysis across regions and quickly view the effects of weather anomalies on both existing and proposed investments.
Looking at wind speeds during the second quarter of 2011, the pattern is 5 to 10% above normal for nearly the entire US. Especially strong positive wind anomalies centered over the southern Mississippi Valley and the southern Rocky Mountains. Some areas within these regions exceeded 25% above normal wind speeds when averaged over all of April, May, and June.
The only areas that experienced wind speeds below average were North Dakota along the Canadian border, isolated areas of California, and along the Carolina coast, and through Florida. These areas saw minor negative anomalies of about 5% with the exception of Florida where wind speeds were up to 15% below normal.
Climate conditions across North America during the second quarter of 2011 were influenced by a weakening of La Niña that occurred this past winter in the tropical Pacific Ocean, leading to neutral El Niño/Southern Oscillation (ENSO) conditions by the end of the quarter. This quarter was also affected by a gradual transition in the Arctic Oscillation (AO) and North Atlantic Oscillation (NAO) from a positive state at the start of the quarter to a negative state at the end.
However, the dominant feature of the second quarter across the US was a stronger pressure gradient and thus much higher than normal winds over the south-central part of the country. The unusually strong pressure gradient resulted from three anomalous patterns that developed during the quarter: an upper-level trough over the northwestern United States, associated low surface pressure in the northern Great Plains, and high surface pressure over the Southeast.
The wind performance map was created by comparing output from 3TIER’s continually updated meteorological dataset with wind conditions averaged over the period 1969 to 2008 from the same dataset. Wind speed values were computed using a numerical weather prediction (NWP) model run at a 15 km resolution and adjusted using available observations. The underlying datasets for the company’s wind performance maps provide clients with operational intelligence for every location within a region and are available in nearly all regions worldwide.
3Tier
www.3tier.com
Filed Under: Uncategorized
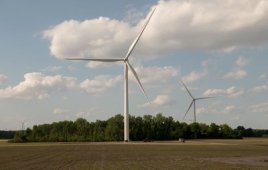

Renewable sources of energy can be best obtained if you are in a windy location. This can save you a lot of electricity and the utility company will even pay you back. Denmark, Spain, Portugal and the Great Britain are utilizing wind farm to power large portions of their communities.