The executive summary here was extracted from the Wind technologies market report by the DOE.

Over the last decade, wind power represented 31% of all U.S. capacity additions, and an even larger fraction of new generation capacity in the Interior (54%) and Great Lakes (48%) regions. Its contribution to generation capacity growth over the last decade is somewhat smaller in the West (22%) and Northeast (21%), and considerably less in the Southeast (2%).
Executive Summary Annual wind power capacity additions in the United States surged in 2015 and are projected to continue at a rapid clip in the coming five years. Recent and projected near-term growth is supported by the industry’s primary federal incentive—the production tax credit (PTC)—as well as a myriad of state-level policies. Wind additions are also being driven by improvements in the cost and performance of wind power technologies, yielding low power sales prices for utility, corporate, and other purchasers. At the same time, the prospects for growth beyond the current PTC cycle remain uncertain: growth could be blunted by declining federal tax support, expectations for low natural gas prices, and modest electricity demand growth. Key findings from this year’s Wind Technologies Market Report include: Installation Trends
- Wind power additions surged in 2015, with 8,598 MW of new capacity added in the United States and $14.5 billion invested. Supported by favorable tax policy and other drivers, cumulative wind power capacity grew by 12%, bringing the total to 73,992 MW.
- Wind power represented the largest source of U.S. electric-generating capacity additions in 2015. Wind power constituted 41% of all U.S. generation capacity additions in 2015, up sharply from its 24% market share the year before and close to its all-time high. Over the last decade, wind power represented 31% of all U.S. capacity additions, and an even larger fraction of new generation capacity in the Interior (54%) and Great Lakes (48%) regions. Its contribution to generation capacity growth over the last decade is somewhat smaller in the West (22%) and Northeast (21%), and considerably less in the Southeast (2%).
- The United States ranked second in annual wind additions in 2015, but was well behind the market leaders in wind energy penetration. A record high amount of new wind capacity, roughly 63,000 MW, was added globally in 2015, yielding a cumulative total of 434,000 MW. The United States remained the second-leading market in terms of cumulative capacity, but was the leading country in terms of wind power production. A number of countries have achieved high levels of wind penetration; end-of-2015 wind power capacity is estimated to supply the equivalent of roughly 40% of Denmark’s electricity demand, and between 20% to 30% of Portugal, Ireland, and Spain’s demand. In the United States, the wind power capacity installed by the end of 2015 is estimated, in an average year, to equate to 5.6% of electricity demand.
- Texas installed the most capacity in 2015 with 3,615 MW, while twelve states meet or exceed 10% wind energy penetration. New utility-scale wind turbines were installed in 20 states in 2015. On a cumulative basis, Texas remained the clear leader, with 17,711 MW. Notably, the wind power capacity installed in Iowa and South Dakota supplied more than 31% and 25%, respectively, of all in-state electricity generation in 2015, with Kansas close behind at nearly 24%. A total of twelve states have achieved wind penetration levels of 10% or higher.
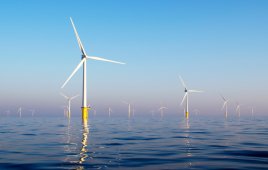
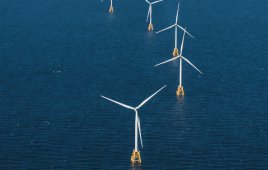
- The first commercial offshore turbines are expected to be commissioned in the United States in 2016 amid mixed market signals. At the end of 2015, global offshore wind capacity stood at roughly 12 GW. In the United States, the 30 MW Block Island project off 2015 Wind Technologies Market Report vi the coast of Rhode Island will be the first plant to be commissioned, anticipated by the end of 2016. Projects in Massachusetts, New Jersey, Virginia, and Oregon, meanwhile, all experienced setbacks. Strides continued to be made in the federal arena in 2015, both through the U.S. Department of the Interior’s responsibilities in issuing offshore leases, and the U.S. Department of Energy’s (DOE’s) funding for demonstration projects. A total of 23 offshore wind projects totaling more than 16 GW are in various stages of development in the United States.
- Data from interconnection queues demonstrate that a substantial amount of wind power capacity is under consideration. At the end of 2015, there were 110 GW of wind power capacity within the transmission interconnection queues reviewed for this report, representing 31% of all generating capacity within these queues—higher than all other generating sources except natural gas. In 2015, 45 GW of wind power capacity entered interconnection queues (the largest annual sum since 2010), compared to 58 GW of natural gas and 24 GW of solar. Industry Trends
- GE and Vestas captured 73% of the U.S. wind power market in 2015. Continuing their recent dominance as the three largest turbine suppliers to the U.S., in 2015 GE captured 40% of the market, followed by Vestas (33%) and Siemens (14%). Globally, Goldwind and Vestas were the top two suppliers, followed by GE, Siemens, and Gamesa. Chinese manufacturers continued to occupy positions of prominence in the global ratings, with five of the top 10 spots; to date, however, their growth has been based almost entirely on sales in China.
- The manufacturing supply chain continued to adjust to swings in domestic demand for wind equipment. With growth in the U.S. market, wind sector employment reached a new high of 88,000 full-time workers at the end of 2015. Moreover, the profitability of turbine suppliers has rebounded over the last three years. Although there have been a number of recent plant closures, each of the three major turbine manufacturers serving the U.S. market has one or more domestic manufacturing facilities. Domestic nacelle assembly capability stood at roughly 10 GW in 2015, and the United States also had the capability to produce approximately 7 GW of blades and 6 GW of towers annually. Despite the significant growth in the domestic supply chain over the last decade, conflicting pressures remain, such as: an upswing in near- to medium-term expected growth, but also strong international competitive pressures and possible reduced demand over time as the PTC is phased down. As a result, though many manufacturers increased the size of their U.S. workforce in 2015, expectations for significant supply-chain expansion have become more pessimistic.
- Domestic manufacturing content is strong for some wind turbine components, but the U.S. wind industry remains reliant on imports. The U.S. is reliant on imports of wind equipment from a wide array of countries, with the level of dependence varying by component. Domestic content is highest for nacelle assembly (>85%), towers (80-85%), and blades and hubs (50-70%), but is much lower (
For the full 102 page report: http://goo.gl/VXAkci
Filed Under: News, Policy, Projects


