The goal of the Zero Failure test is to establish a minimum reliability for an assembly or one of its components, plus the corresponding confidence one has in this test.
John M. Berner / President and Mechanical-Industrial Engineer / Applications Research Inc.
It is important that conclusions from mechanical or electronic tests are presented unambiguously and are clearly understandable to most people. This is particularly true for the Zero Failure test. It uses a Weibull routine, which when properly applied and clearly presented, can save much design and test time. In addition, it avoids potential misunderstandings. This same process might well be used to continuously verify the long-term performance of new multiple-unit installations. A major issue is that, at higher confidence levels, this can be a quite conservative test.
The calculation can get quite tedious. It is also easy to make mistakes if we are required to tighten reliability values. Therefore, we’ve put together a software routine to accomplish this as part of our overall reliability program, Weibull-DR 21. Working through an example shows how to use the test and what the reveals about a product.
Suppose we have to define a required reliability for a line of 3.0 MW turbines. How might we accomplish this? First of all, corporate groups collectively agree to target reliability values.
For example, they might say, “We need to be 90% confident that 95% of our turbines survive the first five years under representative working or test conditions. In addition, we’ve estimated that these turbines output 6,570 megawatt-hours annually”.
This could refer to either a complete turbine or its major, most critical, or expensive components. Over five years, this output amounts to 32,850 MWh.
Assume the analysis of previous warranty-return data indicates a Weibull Shape (or slope) factor, β = 2.5. If you don’t have this type of history available, a good first guess for this type equipment might be between 1.5 and 2.5. Many electronic components are closer to 1.0. Later, the Beta value could be fine-tuned from field data.
With the above, we now have enough information to solve the equation describing the target distribution. We can define the target distribution of the product or component reliability with η, the Weibull characteristic life. It is found with:
η = Tmegawatt-hours / ( ln(1/R))1/ β
where Tmegawatt-hours = target in megawatt-hours (MWh) and R = reliability value from 0 to 1.
If Tmegawatt-hours = 32,850 (5 years), R = 0.95, and β = 2.5, then η = 107,773 MWh, the characteristic life.
Next, we need to satisfy the confidence requirement. In this case, Confidence, C = 90% (to minimize the possibility of a false-positive test).
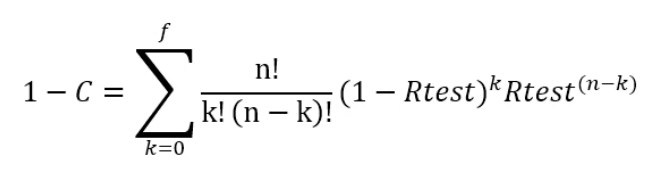
where n = sample size, f = failures allowed, and Rtest = the reliability corresponding to the required test in MWh. Its value is determined by iteration to satisfy the above equation.
For our sample, n = 3, f = 0, Rtest = (1 – C)1/n, and Confidence, C = 0.90, the reliability of the test.
First, calculate Rtest using the figures above, β = 2.5, and η = 107,773:
Rtest = 0.4642.
Now we back-calculate to get the test’s Weibull parameters.
Tmegawatt-hours = η * (Ln(1/Rtest)1/β = 96,957 MWhours,
So the zero failure test reveals that a turbine will produce 96,951 MWh-per-unit without failures.

The table lists results from the zero-failue test.
Assuming 25% capacity factor, we can run 3.0 MW, 90% of full time to accelerate the test. Using three test cells, we should be able to complete this test, exclusive of the blades, within a few months.
Summary
You can be 90% confident that a sample passing this test represents an overall population, the reliability of which exceeds 95% at an elapsed period of 32,850 MWh, or approximately five years.
The graphic above, a report, was generated by the software routine for the values presented here.
For the latest Weibull-DR: www.weibulldr.com or
Filed Under: Projects