Engineers working to increase product quality and reliability will find a working knowledge of statistics invaluable. Design teams can use a conventional test-and-improve cycle or a more formal DMAIC (define, measure, analyze, improve, and control) sequence. However, this part of product development is too critical to simply toss “over the wall” to a test-department.
Without adequate attention and understanding of applicable statistics, much design and development can be a mystery. Questions that often arise include: How many samples should be used? How long should the test run? What do test results mean? How can one quickly calculate accurate figures for a total design reliability?
A system’s overall reliability is the product of its components’ reliabilities. Any component required for successful system operation is treated as a series or chain relationship. Reliability is also, by definition, 1.0 minus the probability of failure within a specified period.
A complex piece of equipment has multiple parts that succeed or fail under specific conditions. A failure means the component no longer performs to a predetermined definition of its function. In addition, a group of “identical components” often fails in a time relationship that may typically be described by a statistical distribution.
Weibull analysis is excellent for calculating this failure distribution. It is flexible and has sufficient parameters to describe a variety of real-life situations. Though commonly referred to as a distribution, a Weibull analysis calculation is simply a statistical curve-fit routine. It works by fitting a smooth curve to what may be noisy or rough data. One represents the data from individual components of a system by two or three Weibull parameters. One can then treat the reliability of the complete system as the product of the reliabilities of individual components. Finally, the best guarantors of reliability are project engineers who care about their work. Let’s look at a wind turbine to see how the analysis works.

F/S refers to Failed/Suspended tests. Order is statistically adjusted to correct for one of the tests being suspended. Median Rank is a system to estimate the midpoint of the interval represented by each data point. Weibull-Ease software calculates the table.
Component groups include a controller, rotor, transmission, generator, brake, and yaw drive. Structural members and safety issues are included. Starting with the control group, correlate stress duration to a variable that can apply to all components.
Megawatt-hours, or sometimes just hours, is a logical variable because most failure modes relate well to these easily measured values.
Once this is established, tests will all correlate to megawatt-hours generated under agreed upon stress levels with all tests documented and correlated to megawatt-hours.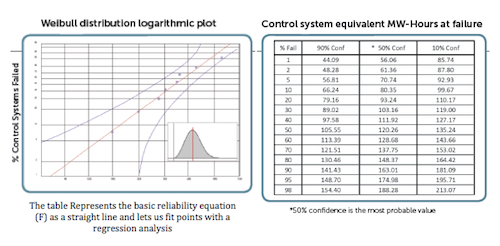 Processing the initial data
This data, generated by tests under controlled conditions can be loaded into standard Weibull analysis routines. Each data (failure) point is arranged by value, and then assigned median rank figures. These figures are generated as part of standard routines. The median rank values adjust the data slightly to help remove intrinsic bias.
A Weibull routine calculates a scale and shape parameters. The procedures are available in a number of texts in the box For further reading.
A third parameter, X, of the Weibull routine is an intentional “offset” value subtracted from or added to each data point. Its value is selected to improve the correlation coefficient of the least squares regression fit of the data. It is determined by an iterative process that operates to find the closest local maxima of this correlation coefficient with respect to this offset.
The analysis would be repeated for all eight of the component groups of a wind turbine (each may have different failure modes) that are critical to the turbine’s function. Once a couple groups are completed, the rest are simply a repetition of these.
The next step consolidates the data generated from all eight of these component groups into a single relationship to represent the complete system. Weibull-Ease software is one such routine for doing just this, calculating and accurately representing the reliability of a complete system by a single equation.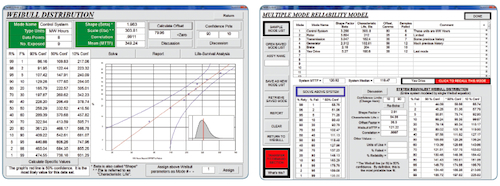 When we processed the original data, the first component failure mode was identified as Mode #1 and assigned so by the Multiple Mode Reliability model. When finished entering this mode, as mode #1, other modes are entered simply clicking the “Retrieve Saved Mode” button and repeating the process.
Next, we do a complete time (in this case, megawatt-hours) sweep and record as discussed in the box, Regarding components critical to successful system operation.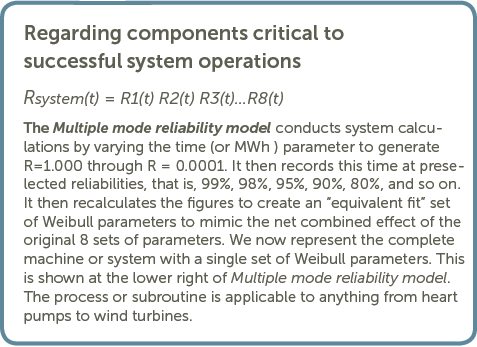 Equivalent Weibull model
In addition to evaluating of each individual failure mode, we have managed to re-fit all modes into a single Weibull model of the complete system (the wind turbine design) with its own unique set of parameters. This total system includes confidence limits. These are based on the least reliable mode. This serves to assure the figures will be conservative.
The figures generated in the Multiple mode reliability model show the chance or probability of a single disabling problem requiring maintenance effort within the system.
WPE
Filed Under: Software, Turbines