By Dr Pascal Storck, Global Manager of Energy Services
& Dr Mark Stoelinga, Senior Scientist
Vaisala
By placing project performance in the context of long-term average wind behavior, Vaisala’s quarterly maps highlight the occurrence of specific quarterly wind anomalies, which can significantly impact the financial health of an operational portfolio.
This article is part of Windpower Engineering & Development’s February 2017 issue. A complete digital version of the issue is here.
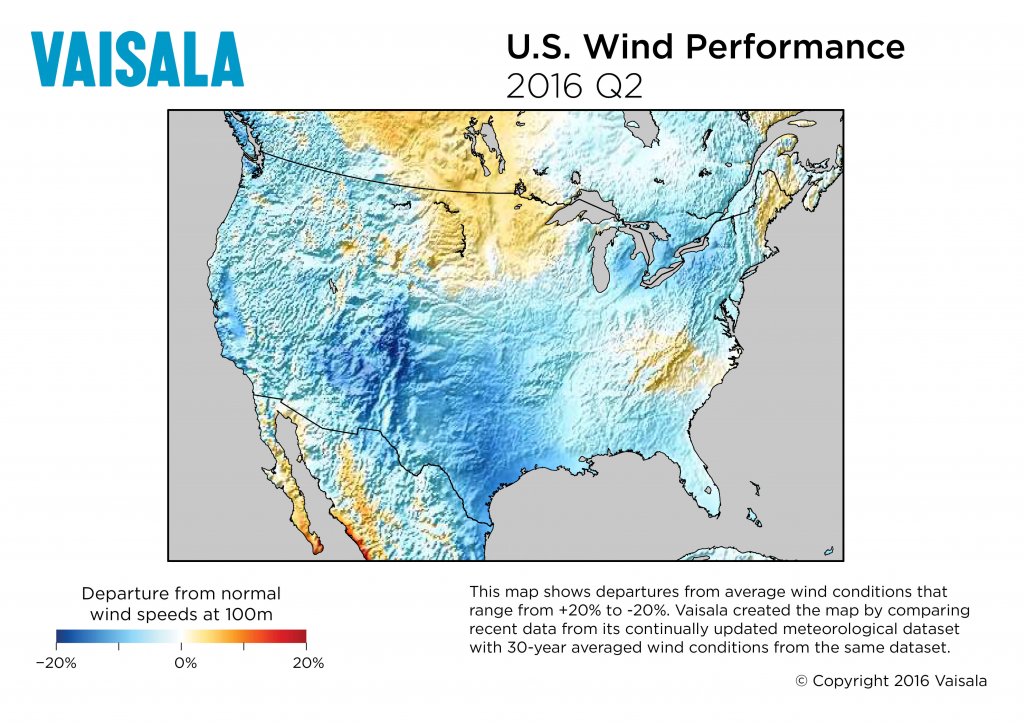
The quarterly U.S. Performance Maps produced by Vaisala show departures from normal wind speeds across the country and help wind operators reconcile recent project performance against actual wind conditions.
Wind portfolio performance analyses have been in greater demand in the industry since the so-called “wind drought” of early 2015. Its record-low wind speeds reduced production across much of the United States, particularly in the key markets of California and Texas, which had some of the lowest wind speeds within the entire historical record.
But what caused the wind drought? Climate scientists point to the same global climate pattern that produced a large mass of warm water off the U.S. Pacific Coast and a blocking high-pressure system over much of the West.
These features are related to oscillations in large-scale climate signals, such as the North Pacific Mode and El Niño, which provide strong predictors of weather.
In September 2015, the largest El Niño event in recorded history was developing in the Pacific Ocean. With a climate signal this strong, weather predictability should have been high using past events as a proxy for future conditions. According to typical patterns, El Niño was expected to bring above normal wind speeds to California and the West Coast, and continue to bring below normal wind speeds to the U.S. wind belt, including Texas and the Midwest.
However, despite the record El Niño, the event did not manifest itself as forecasted. The largest impact to wind speeds was expected to come in the winter, but instead arrived in the second quarter. It is likely this El Niño did not produce the expected trends in U.S. wind resource because its tropical ocean warm anomaly shifted west from the more typical location for major El Niño events.
The climate-science community has dubbed this type of El Niño “Modoki,” a Japanese word that roughly translates as “the same but different.”
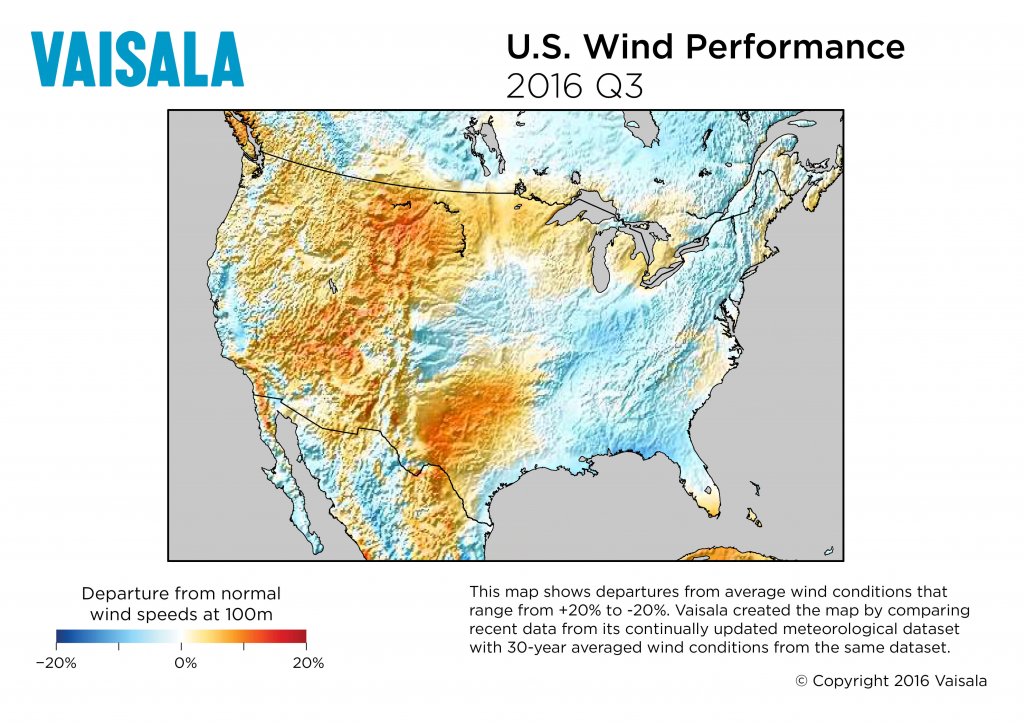
Vaisala conducted the study by comparing 2016 data from its continually updated meteorological dataset with 30-year averaged conditions from the same dataset.
While seasonal forecast accuracy remains a challenge, wind operators still must find ways to set annual budgets based on expected project performance. Current forecasting methods are typically simplistic and can result in large inaccuracies. These errors reduce shareholder value and confidence.
In a business where revenue can vary extensively based on weather and climate, how can operators set responsible budget expectations? The best approach is to leverage numerical weather prediction modeling and historical data.
This lets operators establish reasonable benchmarks across a portfolio, which can be re-calibrated on a monthly basis to more accurately forecast revenue. Portfolio diversification is another strategy for mitigating the effects of events, such as the 2015 wind drought. This involves deploying assets across different regions and technologies to mitigate the financial impact of below average performance in any one area.
Although not a new concept in the wind industry, climate-resilient portfolios based on long-term historical weather correlations that help clients reduce performance risk to better maintain investor confidence with steady returns. 
Filed Under: News, Projects