Editor’s note: The report on the impact of the federal tax extensions is authored by Trieu Mai, Wesley Cole, Eric Lantz, Cara Marcy, and Benjamin Sigrin at the National Renewable Energy Laboratory — NREL. The Executive summary is below and the full 42-page report is here:
http://www.nrel.gov/docs/fy16osti/65571.pdf
Federal tax credits for renewable energy (RE) have served as one of the primary financial incentives for RE deployment over the last two decades in the United States. In December 2015, RE tax credits, including the wind power production tax credit and solar investment tax credits, were extended as part of the Consolidated Appropriations Act of 2016. The act extended the solar and wind tax credit deadlines by five years from their prior scheduled expiration dates, but included ramp downs in tax credit value during the latter years of the five-year period. This report explores two specific questions: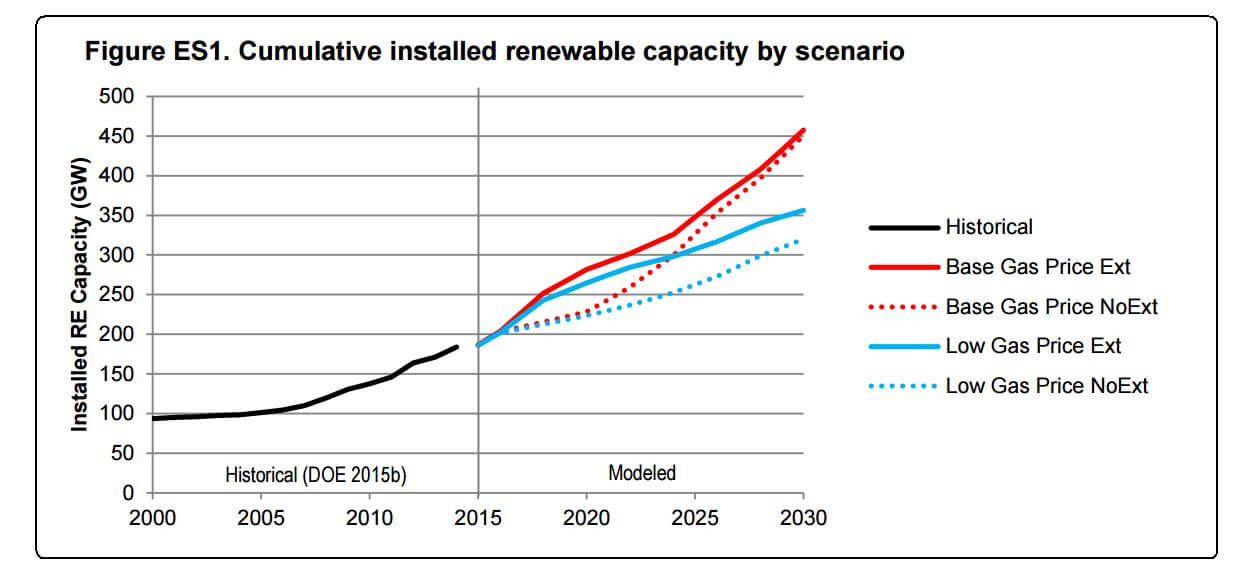
(1) How might RE deployment in the contiguous United States change with these recent federal tax credit extensions?
(2) How might this change in RE deployment impact carbon dioxide (CO2) emissions in the power sector?
We use a scenario analysis approach to estimate the impacts of the tax credit extensions under two distinct natural gas price futures.1 Under both sets of natural gas assumptions, we find that scenarios with RE tax credit extensions show greater renewable technology investments through the early 2020s than scenarios without extensions.
In all scenarios, nearly all of the estimated growth in RE capacity is primarily comprised of new solar and wind capacity. Scenarios with tax credit extensions also show lower CO2 emissions from the U.S. electricity system.
Under base natural gas price assumptions shown in Figure ES1, the scenario with tax credit extensions (solid red line) results in a higher rate of renewable capacity additions through the early 2020s compared with the scenario without tax credit extensions (dotted red line) and compared with recent historical rates during 2010 to 2014 (black line). Incremental RE capacity driven by the tax credit extension—defined as the RE capacity differences between the extension and noextension scenarios—is estimated to peak at 53 GW in 2020. By the mid-2020s, other drivers (most notably assumed reductions in the costs of RE generation technologies and assumed rising fossil fuel costs, coupled with the Environmental Protection Agency’s Clean Power Plan [CPP] ) propel continued growth in cumulative RE capacity through 2030 under both extension and no-extension scenarios. During this period, these drivers have a greater impact to RE deployment in the scenario without tax credit extensions; the scenario with extensions is not found to result in significantly greater cumulative RE deployment in the long run (by 2030).
The results suggest that RE tax credit extensions can accelerate renewable deployment through the early 2020s, thereby helping avoid what otherwise might be a near-term decrease in the rate of RE development compared to recent years; but the impacts of tax credit extensions to cumulative installed RE capacity are noticeably less significant by 2030 under base natural gas price assumptions.
With lower natural gas price assumptions, RE capacity deployment is lower with tax credit extensions (solid blue line) and without (dotted blue line) compared to the respective base natural gas price scenarios (Figure ES1). Through 2020, greater RE capacity additions are found in the scenario with extensions than the one without under lower natural gas price assumptions; however this incremental amount of RE capacity is slightly less during this time period compared to the incremental RE capacity with base natural gas prices. With lower natural gas prices, incremental RE capacity driven by the tax credit extension peaks in 2022 at 48 GW and much of this incremental RE capacity persists through 2030. However, the tax credit extension scenario with lower natural gas prices shows fewer absolute RE capacity additions, especially after tax credits expire, than the extension scenario with higher base natural gas prices.
Footnote 1: This analysis uses two natural gas price scenarios. The “base natural gas prices” scenario (or Base Gas Price) is based on the EIA Annual Energy Outlook 2015 Reference case. The “lower natural gas prices” scenario (or Low Gas Price) is based on the EIA Annual Energy Outlook 2015 High Oil & Gas Resource case. 2 The analysis, conducted in January and February 2016, is designed to evaluate impacts of the tax credits based on policies as of January 1, 2016 only. While the U.S. Supreme Court issued a stay for the CPP on February 9, 2016, the rule was not overturned and is thus included in all scenarios in our analysis. This report includes modeling of a single simplifying representation of the CPP and does not assess the tax credit extension impacts across a range of different CPP compliance scenarios.
Filed Under: Financing, News