With more accurate weather predictions, utilities, power traders, and asset owners can leverage wind-power forecasts to control risk and produce revenue-generating opportunities.

Todd Crawford
Dr. Todd Crawford, Chief Meteorologist, The Weather Company, an IBM Business
In recent years, the term “big data” has become quite the buzzword. Businesses of all types have to deal with the availability of an exponential increase in data and new data sources. The big-data revolution is here so businesses must stay ahead of the curve if they are to maintain a competitive marketplace advantage.
For the power industry, weather is a key driver. Power traders are interested in fluctuations in weather-driven supply (wind power, and to a lesser extent in the U.S., solar power) and a demand or load forecast that ranges from a few minutes to a few weeks. The interest is justified because of substantial price fluctuations when wind generation is more or less than expected, or when demand is substantially less than expected.
An accurate prediction of winds and loads is important to utilities and asset owners because it helps plan for generation demands in the upcoming hours and days. If load forecasts are too low or wind forecasts too high, consumers experience higher rates because the supply-demand imbalance requires purchasing power from more costly quick-response power sources.
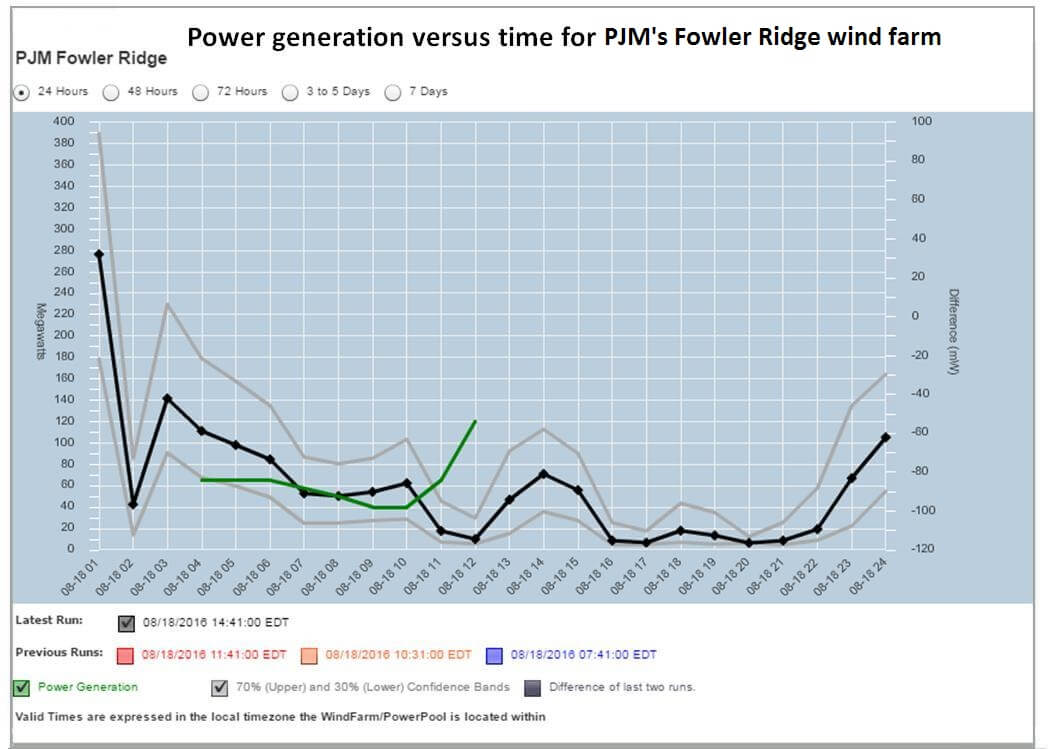
The plots are for the forecasted and observed wind power generation at the Fowler Ridge Wind Farm in PJM. The green line shows the observed generation, the black line shows the forecasted generation and the gray lines bound the uncertainty of the forecast. 40% of the time the observed value should be within the gray uncertainty bands
Organizations such as The Weather Company (formerly WSI) help mitigate those issues by leveraging weather models and advanced statistical techniques to create “big weather” wind-power and load (power demand) forecasts with market-leading accuracy. To produce wind forecasts, multiple weather models such as the company’s Deep Thunder, an advanced hyper-local weather forecasting model for businesses, are intelligently blended and weighted, with the more accurate models having higher weights. The models that are more accurate will get higher weights when the blending and optimization is done.
For example, consider just two models. Model A (the better one) gets a 75% weight and Model B gets a 25% weight. Suppose Model A forecasts a high temperature of 90° while Model B forecasts 80°s. Because Model A has a higher weight the optimized or “blended” forecast in this case is 87.5 degrees. In reality, we use well over 100 models to do this blending. The optimized forecasts are then ingested in a statistical model developed by the company’s partner Genscape, and which generates wind-power forecasts.
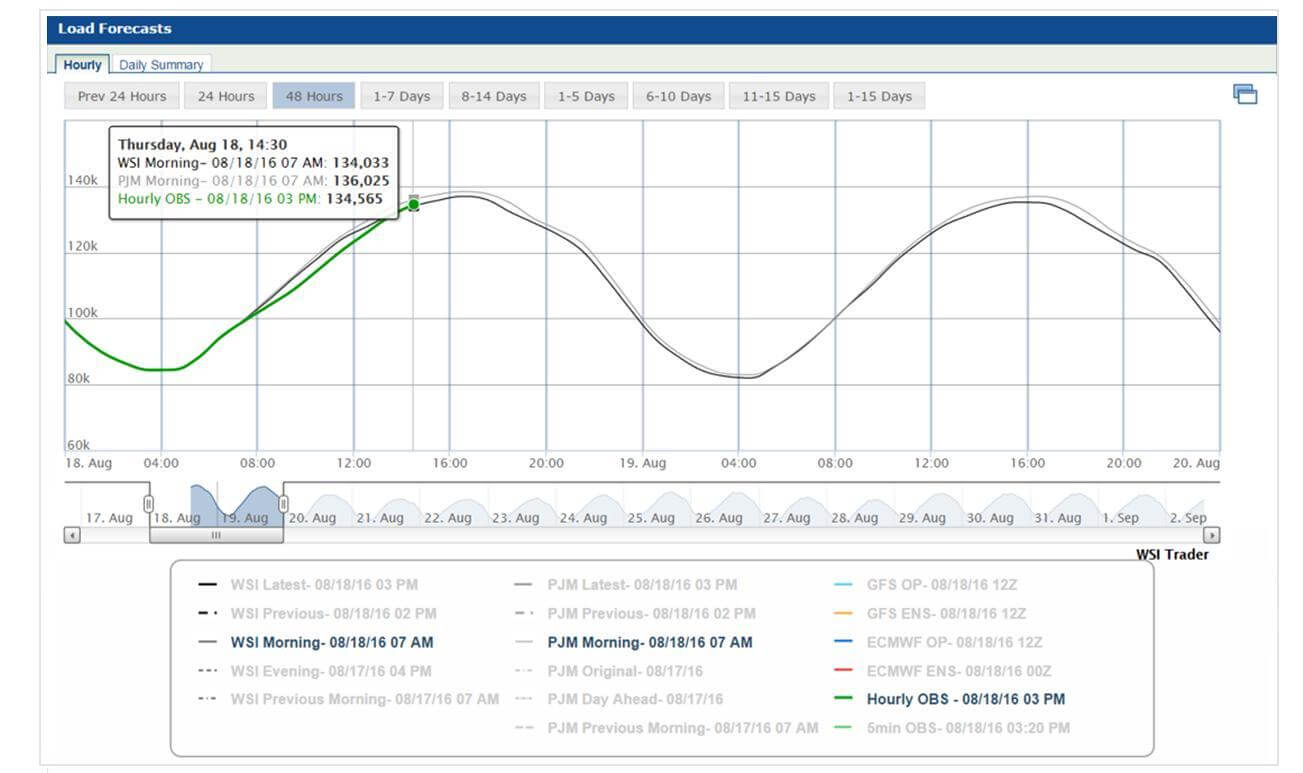
The forecast (dark black line) is compared to the freely-available forecast from PJM (light black line). The actual load (green) plots in real time. Source: The Weather Co.
These forecasts are leveraged by power traders, utilities, and asset owners to control risk and produce revenue-generating opportunities. Wind-power forecasts represent the individual wind farm level all the way up to ISO-level aggregate wind-power forecasts.
The Weather Company has recently made investments to further improve its weather forecasting system and data science capabilities. The forecasting system provides for the most accurate, timely, and spatially resolute (small scales or areas) weather forecasts in the industry.
At the same time, expertise in data science lets us convert these accurate weather forecasts into user-friendly products for clients in the utility and energy trading businesses.
One exciting new tool – a load-forecasting algorithm for U.S. power pools – produces forecasts each hour at hourly resolution out to 15 days. The Load forecasts plot provides example recently made for the PJM power pool.
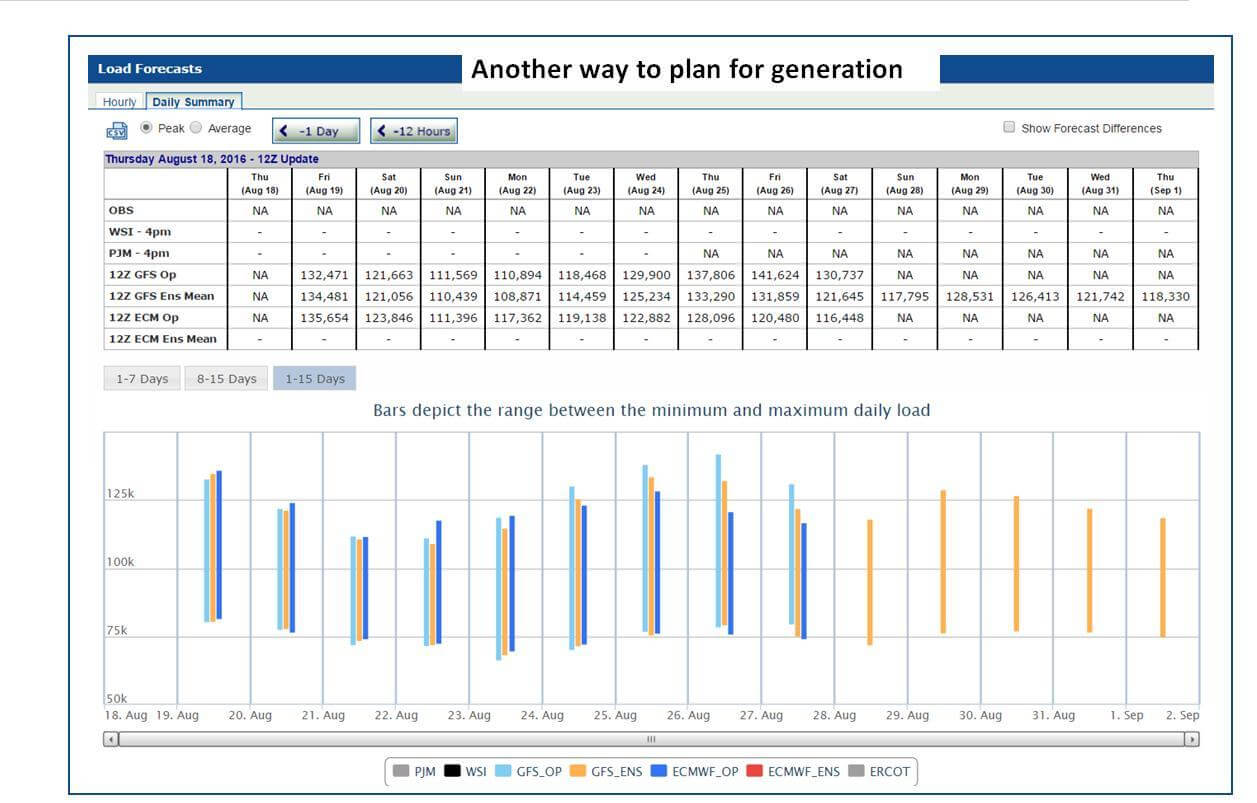
The Load Forecasts provides predictions in tabled figures (top) and the vertical bar charts. Source: The Weather Co.
This load-forecasting algorithm exhibits errors (expressed with the metric MAPE or Mean Absolute Percentage Error) of generally less than 2% (for the aggregate ERCOT power pool region) during the first three days of the forecast, rising to 3 to 4% by day 6 and 4 to 5% by day 9. If you compare this to archived ERCOT-produced load forecasts as far out as 180 hours, it indicates that the load-forecasting algorithm produces highly accurate forecasts. For example, predictions from the new tool have lower errors than ERCOT-produced load forecasts for 98% of the forecast hours, with relative improvements ranging from 5 to 20%.
In addition to forecasts, the company has developed an algorithm that generates load forecasts directly from weather models in real-time as weather forecasts are produced. Having this information lets power traders quickly discern important changes in weather forecasts that will impact expected loads from one day to one week, and lets them make favorable trading decisions that can result in significant profits.
The use of advanced weather forecasts and data science techniques allow developing algorithms and products for accurate wind-power and load forecasting. These products are versatile enough so that power traders, utilities, and asset owners all benefit from the information. In these days of the big data explosion, it’s more important than ever to capitalize on the intelligent blend of the best weather and the best data science available.
Filed Under: News


