Philip Totaro / CEO / Totaro & Associates
With more than 7.0 GW added in 2017, the United States wind energy market is seeing robust growth. Vestas has maintained its leadership position in annual capacity additions with 2.5 GW while GE maintains a close second at 2.0 GW.
SGRE had a noteworthy uptick in capacity additions to 1.6 GW and Nordex-Acciona comes in 4th at 0.8 GW. GE still leads in cumulative capacity in the U.S. market when consolidations in the OEM space are accounted for in the share calculation. GE retains a 42.2% share with Vestas second at 24.1% and SGRE at 19.1% in third place.
Goldwind leads Chinese OEMs in the U.S. market with more than 18 MW now cumulatively installed. Average rotor size showed a slight uptick with 102.4m for 2017, with average size projected to reach 120m by 2024.
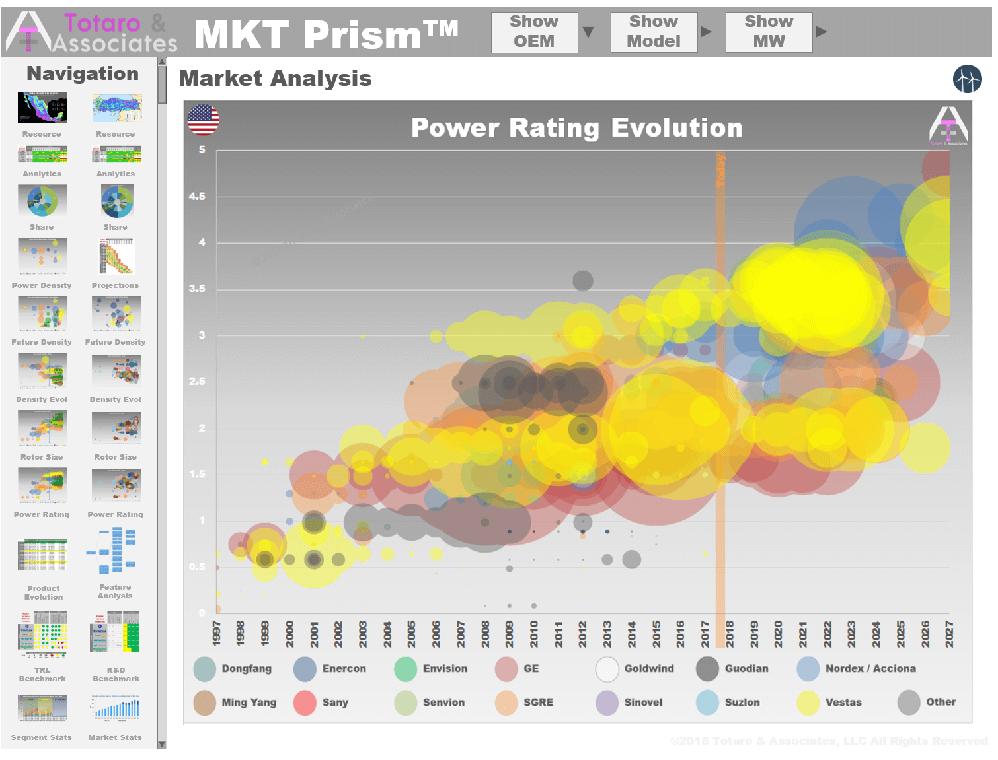
Average power rating remained steady with 2016 at 2.16 MW, but this noteworthy breaking of the 2.0 MW barrier shows the general upward trend for the market. Average power rating above 3.0 MW should be achieved by 2022.
Just over 49% of the annual capacity additions in the U.S. in 2017 were for turbines with a power density between 180 to 229 W/m2.

Simple average power density of all annual 2017 capacity was 262 W/m2, with an expected rise in power density range in the coming years as the market will hopefully exploit more of the wind resource potential.
The fact that significant wind resource potential remains under-exploited is effectively due to historical patterns in product development and capacity build-out by developers.
When evaluating the market based on the power density of the turbines (i.e. power rating of turbine / swept area of the rotor), we see an interesting trend emerge, where capacity additions are largely concentrated around turbines with standard IEC wind class distribution.

But when the market potential is over-layed on this installed base distribution, an interesting trend emerges. Specific segments of the market are seeing saturation with multiple OEMs competing fiercely for market share with overlapping turbines in the same power density range. In other market segments, such as a power density range of 230 to 239 W/m2, the U.S. market is seeing little to no capacity penetration whatsoever up through 2017.
The reason for this is that project developers have historically favored the wind regimes with the best proximity to transmission as well as the availability and scale of turbines, which were aligned with IEC wind class sites. This has ensured maximum payback on project sites in the past, but it has left a significant portion of the U.S. wind resource to see little deployment.
As a result, some OEMs have taken note of this development pattern and created a robust product portfolio which can be offered in any market segment. Combined with modular turbine technology architecture, they are seeing better production economies of scale with their product portfolios.
Get more on this U.S. market analysis with a Research Subscription from Totaro & Associates and learn more about how MKT Prism predicts the future by analyzing historical data patterns in every wind market in the world. For more www.totaro-associates.com/mktprism
Filed Under: Uncategorized


