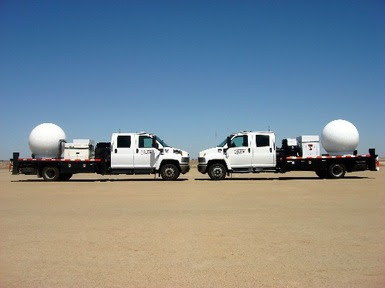
Over the past few years, Texas Tech University researchers have been collecting and analyzing dual-Doppler wind speed and direction data from operating wind plants using their unique Ka-band (TTUKa) mobile Doppler radars. Researchers have documented features of complex flow including turbine wakes, turbine-to-turbine interaction, wind speed ramps and small-scale gust/lull features calle d “streaks.”
Their valuable observations have led to a desire to understand how the dual-Doppler radar measurements compare with more traditional wind-assessment tools. To address this question, the DOE sponsored the eXperimental measurement campaign for the Planetary boundary layer Instrument Assessment (or XPIA) in the spring of 2015. Over 120 hours of radar data were collected in coordination with a 300 m tall instrumented meteorological tower and other traditional remote-sensing platforms (such as profiling and scanning lidars, radar profilers, and radiometers).
The TTUKa scanning strategies yielded a 2.5 km x 2 km area of horizontal wind speed and direction data with points every 10 m in the plane. Additionally, data from 15 horizontal planes located from 40 m to 180 m above ground yielded an overall measurement volume. Quality radar data were acquired across a variety of conditions, including rain, snow and clear air.

Figure 3. Volumetric representation of the wind maps at 50, 100, and 150 m at 22:11 UTC. The viewing angle is from the southwest. Wind speeds in m/sec.
On April 2, 2015, an extensive dataset was collected as light to moderate snow fell over the XPIA domain. Three levels of this dual-Doppler volume are displayed in Figure 3. A complex wind field is evident at all three levels with lower wind speeds on the edges of the domain and higher wind speeds in the center. A faint wind-speed deficit extending from the location of the 300 m tower (indicated by clear gaps in the data planes) suggests a slight wake being produced by the tower. This wake signature was also seen in composite images and noted to extend more than 1.5 km downstream.
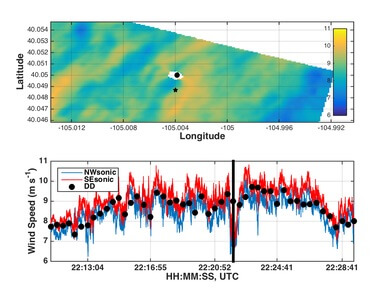
Spatial variability of the wind field contributed to the differences noted between dual-Doppler wind speeds and the 300 m tower wind speeds. This difference is illustrated in Figure 4 that displays the 100-m dual-Doppler wind map over the time histories of the sonic anemometers mounted at 100 m on the met tower.
At 22:22 UTC (noted by the black vertical line Figure 4, bottom), the 100 m sonic wind speed dropped from near 10 m/sec. to just above 7 m/sec as a transient lull passed through the latticed tower. At a location just 100 m south of the tower (noted by the black star in Figure 4, top), the dual-Doppler measured that wind speeds remained near 9 m/sec. as the lull passed just to the west of that location.
Despite a few such anomalies due to the propagation of boundary layer features, the dual-Doppler wind speed 100 m south of the tower compared extremely well to the time histories of the sonic anemometers.

Figure 4. Truncated 100 m wind speed map at 22:22 UTC. (Top) The tower is indicated by the solid black circle, while data from the time history below is taken from the location indicated by the black star. (Bottom) Wind speed time histories from the 100 m sonic anemometers of the tower and the dual-Doppler wind speeds from the location indicated by the black star.
The dual-Doppler comparisons of April 2, 2015, while only a small sample of the entire XPIA dataset, represent the results obtained throughout the project. Comparisons between the dual-Doppler and sonic anemometer wind speeds were excellent with correlation coefficients at above 0.90 for the analyzed datasets.
Additional comparisons between the TTUKa dual-Doppler data and a WindCube profiling lidar also yielded correlation coefficients near and above 0.90. The strong agreement between the data from the TTUKa radars and the other instrument platforms affirms the use of radar technology as a reliable tool for wind assessment.
A summary of these results, and those of other instrument platforms that participated in XPIA, is forthcoming in a technical report and submissions to academic journals.
Filed Under: Uncategorized


