 U.S. electricity production is expected to increase by nearly 30% by 2030 to meet growing demand. Power generated by wind will be a large part of that figure. To ensure it is a major contributor, the wind industry’s is updating its equipment fast in a constant drive for greater reliability, higher outputs, and lower costs. More interest in wind power has also encouraged research and experimentation with a greater variety of turbines and equipment, and that effort is yielding many improvements and new designs.
The research effort has produced steady growth in turbine size that will take advantage of economy of scale. For instance, today’s largest working turbines can output over 6 MW and at least two designs on the drawing boards top out at 10 MW. At this writing, just about everything in turbine development is changing, from foundations, the tower, through the drive-train and generators.
The trends in a nutshell are toward larger turbines that capture more energy, direct drive units for improved reliability, and offshore installations (and taller towers onshore) to capture stronger and steadier winds.
The basics of windpower
Wind turbines fall into two basic categories: those with either vertical or horizontal axes. Briefly, vertical-axis units place their generating equipment (gearbox, generator, inverters, and electrical equipment) near the ground and let a series of blades rotate about a tall vertical shaft (axis).
Horizontal-axis designs, more widely used, employ a two or three-blade rotor to capture wind energy and transmit mechanical power to a generator mounted in a nacelle atop a tall tower. There are pros and cons to each.
Vertical axis wind turbines
Small or residential vertical-axis wind turbines (VAWT) use shafts or axis can be 4 to 18-ft tall. On designs closer to utility-scale turbines, the shaft reaches 30 ft.
The advantage of a VAWT is that its serviceable equipment is near the ground for easy access, and there is no need for positioning or yaw equipment to keep rotors pointed into the wind. Their drawback is their relatively low efficiency and capacity. Some calculations show a VAWT being 20% efficient at best. Only half of the profile is generating torque while the other generates a slight drag. By design, they are working near the ground where wind is slower and less useful. One solution is to mount VAWTs on buildings to put them in stronger wind than at ground level.
Shorter VAWTs can work reasonably well without guy wires to steady the top of the axis. Taller designs require guides to keep the top steady and prevent undue wear on the bearing at the tower base. Recent research shows that when placed close together (within four rotor diameters) an array of VAWTs can yield ten timex the energy as when more widely spaced.
In addition, some researchers think the VAWT design can be scaled to 10 MW more easily than a HAWT. And then by designing one to float, it could be mounted offshore to solve its drawbacks, such as taking weight off the otherwise necessarily large generator thrust bearing.
Horizontal axis wind turbines
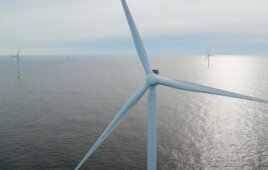
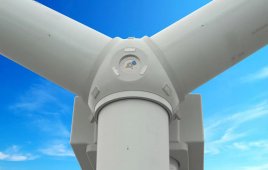
Horizontal-axis wind turbines (HAWT), the more frequently encountered design, place a 3-blade rotor and generating equipment as high as possible on a tower. More blades in light wind may be useful, but become costly in utility-scale turbines. The rotor drives a speed increaser – a gearbox – which turns a generator. Gearboxes have been troublesome equipment in years past, so many recent turbine developments have eliminated them in favor of direct-drive designs.
Most utility scale wind farms have settled on this general design because it scales well into the multi-MW range, and the towers allow placing the equipment 60 to 90 m (200 to 300 ft) up where winds are stronger and more constant.
The electricity generated by a utility-scale wind turbine is collected before it’s fed into utility power lines or the grid, where it supplements the base load (the constant or steady amount of power generated by a conventional power plant). After collecting the power, large inverters synchronize the power to the grid.
Utility-scale wind turbines for land-based wind farms come in various sizes, with rotor diameters ranging from about 50 to more than 100m, and with towers of roughly the same dimension. A 100-m turbine (rotor) at the large end of the scale on a 100-m tower would have a total height from the tower base to the tip of the rotor of about 155 m.
OEMs
Original equipment manufacturers are the brand-name turbine producers. They do most of the turbine research often with the assistance of government labs such as Risø in Denmark and NREL in the U.S. These companies are responsible for most of what goes into the nacelle although they may not manufacturer it. Items such as gearboxes and generators, and large bearings often come from other companies, but the OEMs work with firms that manufacturer them when they specify such complex components.
Once all components are specified, the OEM assembles them and writes their maintenance requirements.
Electrical power is measured in Watts (W). It’s a relatively small unit so those more frequently encountered are the kilowatt (kW) or 1,000 W, and the megawatt (MW) or 1,000,000 W. Utility-scale wind turbines are usually identified by the maximum amount of power they can produce, also called their rating. Common figures are from 1 to 6 MW with larger units on the drawing board.
Electricity production and consumption are most commonly measured in kilowatt-hours (kWh). People and companies pay for the number of kilowatt-hours they consume. A kilowatt-hour is one kilowatt (1,000 Watts) of electricity produced or consumed for one hour. One 100-W light bulb (or any 100-W load) left on for 10 hours consumes one kilowatt-hour of electricity. For example:
100W × 10 hours = 1,000 watt-hours
= 1 kilowatt-hour
Electric bills usually identify the cost of power for their service area in $/kWh. In the Midwest, power cost about $0.12/kWh, a figure that includes generation and transmission costs. Some eastern utilities charge more, about $0.20/kWh, and some western states where hydropower is available and coal is inexpensive, about $0.10/kWh.
Power in the wind
A few basic calculations provide good insight to the issues of wind-turbine design. Wind is an air mass moving from a high-pressure area to one of low pressure. To calculate the energy in wind, consider a segment of air shaped like a horizontal cylinder. The energy in it depends on the volume of air, density, and wind speed. The mass per unit of time for a slice of the cylinder is:
M = ρAV
where
M = mass, ρ= density, A = area, and V = wind speed
To better understand the turbine’s operation of transforming the wind’s kinetic energy into electricity, start with a calculation of kinetic energy, Ek, where:
Ek = ½ MV²
Substituting the mass of the air cylinder (ρAV = M) gives
Ek = ½ ρAV³
Thus, the amount of energy in the wind depends on the density of the air, area (in this case, the area swept by the wind-turbine rotor) and the cube of the wind velocity. The equation underscores the point that selecting an area of strong winds is advantageous because the power in the wind increases with the cube of its speed. That means wind at 10 m/s has eight times the kinetic energy, Ek, as wind at 5 m/s.
The equation looks impressive, but wind turbines are not 100% efficient. If a turbine was completely efficient it would transform all kinetic energy from the wind into electricity. This would mean the wind velocity would drop to zero behind the rotor. Of course, that does not happen. In fact, Albert Betz published a book in 1926 that showed it is only possible to extract 16/27 or 59% of the energy from a wind turbine. This is known as the Betz law.
Therefore a max theoretical energy model for a wind turbine is:
Ek max = 16/27 (½ ρAV³)
In practice, however, the amount of extractable energy ranges from only 40 to 47%.
The amount of energy extracted from the wind is directly proportional to the swept surface area. Now consider that:
A = πr²
= ¼πD²
Into the equation for energy gives:
Ek max = 16/27 (½ρ)¼π D²V³
= (2/27πρ) D²V³
Hence, a turbine’s power output is proportional to the square of the rotor diameter and cube of the speed. Another way to get a feel for what that means, consider the figures in the table on the next page. For an increase in rotor size, compare adjacent figures. To see how a wind-speed increase improves power, read down each column. For instance, a small increase, from 10 to 12 m/s, almost doubles the power available.
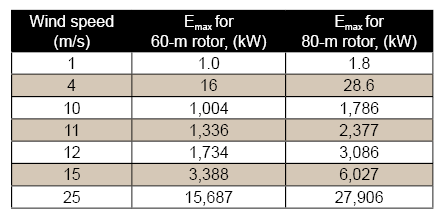 How wind speed translates to power
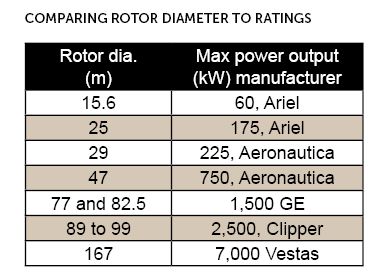
Large wind turbines leverage economies of scale with an increased blade diameter. The industry has increased diameters from 40 meters and 20 to 60-kW outputs in the 1970s to recent 90-m rotors on 3-MW designs. The largest wind turbine at this writing is a 7+ MW, 126 m (413 ft) three bladed design engineered by a German firm. With better simulations, materials, and manufacturing, some predict 250-m rotors on 20-MW machines by 2020.
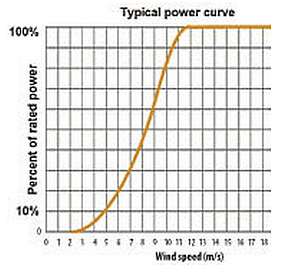
The power-versus-wind speed curve of a typical utility-scale turbine shows that a turbine starts producing power at about 4 m/s and reaches its rated or maximum power output at about 14 m/s. At about 25 m/s, the turbine has reached its maximum rotational speed. Any faster and the controls will shut down the turbine.
Capacity factor
It is a way to measure the productivity of a power-producing facility. A capacity factor compares the plant’s actual production over a given period of time with the amount of power the plant would have produced had it been running run at full capacity for the same amount of time, that is:
Fcap = Pact /Pmax
where
Fcap = capacity factor, Pact = actual power produced, and Pmax = power at maximum operating capacity, often at wind speeds 14 m/s mph and greater. For example, a 1.5-MW turbine operating at full capacity around the clock for a year would produce:
Pmax = 1.5 MW × 24 hr/day × 365 d/yr × 1 yr
= 13,140 MWh
However, from normally variable winds, its records might show it generated only 5,214 MWh. Hence, its capacity factor would be;
Fcap = Pact /Pmax
= 5,214 MWh / 13,140 MWh
= 0.39 or 39%
A conventional utility power plant consumes fuel, so it normally runs most of the time unless idled by maintenance or mishaps. A capacity factor of 40% to 80% is typical for conventional plants.
An availability factor, another reliability measure of a power plant, refers to the percentage of time a plant is not out of service and available to generate power. Modern wind turbines have an availability of more than 98% — higher than most other types of power plants.
Offshore versus onshore
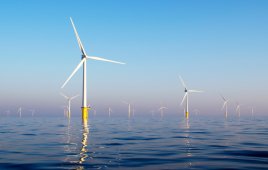
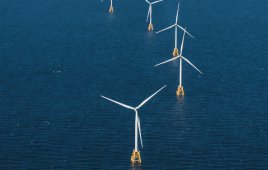
Mounting turbines for offshore wind has grown more widespread in the last few years, mostly in Europe. Developers in the U.S. are eying the Great Lakes as well as the Eastern Seaboard and areas offshore Texas, Washington State, and Oregon. Such locations are attractive because stronger and steadier winds are more prevalent there than they are on land.
Of course, there are problems in constructing towers for offshore wind due to foundations that will be underwater. An allowable or manageable water depth is a matter guided by economics — it’s expensive. A lot of marine equipment will be needed to ferry large structures to offshore locations and then secure them to the ocean floor.
A recent presentation showed that a position about eight miles offshore reduces turbines to near invisibility. However, that may put them in deep water. One solution to offshore turbine towers is to let them float. Several floating structures have been proposed.
Sea water presents another offshore wind problem in that it’s rather corrosive, so offshore turbines will need more durable seals and more reliable equipment because at times the turbines will be inaccessible.
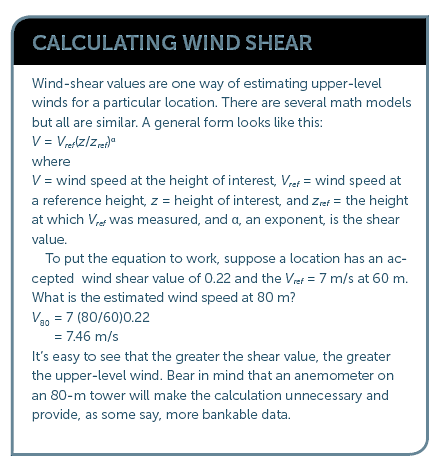
The Midwest typically has higher wind-shear values than the 0.14 rule-of-thumb used elsewhere. In many places, especially the upper Midwest, shear values are around 0.3 and are conservatively sustained from 0.22 to 0.26. Using an average 7 m/s wind speed at 65 m and a shear value of 0.24, turbine output from a typical 2.5-MW machine installed at 80 m reaches 8.2 million kWh/year. Increasing the height to 100 m lets the turbine produce close to 1 million kWh/yr more. With a Power Purchase Agreement of $0.06/kWh, a 20-m-taller tower will annually produce an additional $60,000.
However, conventional 100-m towers in the U.S. are relatively costly and in many instances nearly double the cost of an 80-m tower. That does not include increased transportation costs associated with large tower sections. Simply increasing the height of a conventional welded tubular tower may not be the most cost effective way to reach the greater wind speeds.
An alternative tower design will be needed and several designers have ideas. Modular designs of 100 m provide one solution to the cost problem. These towers would have a continuous taper as an efficient way to handle wind-turbine loads. One design, for example, uses field-assembled panels to eliminate transportation restrictions. The design allows adding tower panels to increase tower diameter and height. Increased diameters allow for thinner tower-wall thicknesses, resulting in a more efficient use of steel, thus lowering weight and cost. Flanges at the tower top and base allow for a conventional interface with the turbine and foundation. Flanges use the same mounting criteria as conventional towers. However, the increased bottom diameter presents new options when designing the foundation. Wider foundations, for instance, require less depth, thereby eliminating the need for costly embedment rings often used in conventional foundations.
Grid
The technology for reaching the goal of energy independence is available today. The only thing lacking is a national energy policy and a modern electric transmission grid.
The U.S. operates about 164,000 miles of high-voltage electric transmission lines. These are divided into about five grids. Despite its vital role, some say the transmission grid has been neglected and allowed to become outdated over the past three decades. While electricity demand increased by about 25% since 1990, investment in new facilities has decreased about 30%. While investments are still being made, the growth of the transmission system hasn’t kept up with demand.
Today, 70% of the nation’s transmission lines and large power transformers are at least 30 years old. Experts agree that America’s transmission grid is in need of investment. for instance:
• The American Society of Civil Engineers gave the nation’s energy infrastructure a D in the organization’s 2009 Report Card for America’s Infrastructure.
• According to the U.S. DOE, transmission and distribution losses grew from about 5% in 1970 to 9.5% in 2001, primarily due to heavier use and more frequent congestion.
• The North American Electric Reliability Corporation has documented that the present transmission system will require “significant transmission additions and reinforcements” to accommodate the widespread integration of renewable resources.
Congested transmission lines and an outdated infrastructure have compromised efficiency and led to brownouts and blackouts. According to the DOE, major power outages and power quality disturbances cost our economy between $25 billion and $180 billion annually.
Filed Under: Featured, Projects, Turbines

Hi Kathleen
Could you give me a link or reference for the “recent presentation” you mention in your article above that shows that turbines situated 8 miles offshore are nearly invisible.
This does not appear to be true from my observation of OWFs ; hence the introduction of a 22km buffer zone in Germany, Belgium, Netherlands, etc.
Jamie:
The comment came from an offshore wind conference in Washington DC during Spring of 2011. The speaker had several slide of offshore turbines at varying distances. At 8 miles, the tower were just visible but the blades were not.
I’d have to dig out my notes to find the specific speaker. Hope that helps.
Paul Dvorak
Nice concise article explaining wind power
Glad to hear that’s what we were aiming for!