OriginLab, a publisher of data analysis and graphing software, says its Origin software let researchers Dr. Ray Huffaker, University of Florida, and Dr. Marco Bittelli, University of Bologna, present wind pattern findings that represent a paradigm shift in how wind projects may be viewed. The researchers’ observations of periodic, cyclical paths to wind modeling could create opportunities that drive commercial wind power viability that could be scheduled and integrated into the power grid.

Researchers have observed periodic, cyclical paths to wind modeling that could create opportunities to drive commercial wind power viability that could be scheduled and integrated into the power grid.
Wind has typically been treated as a random probability. Without a method to predict wind supply, most U.S. wind farms were placed in gusty areas that received ample wind, such as the Midwest. However, Drs. Huffaker and Bittelli have created a valuable experiment that may open more regions, regions with high population and demand for renewable energy, yet low average wind speed to supply it, to wind energy production. The intent of their study was to determine whether enough predictable wind supply existed to correspond with power demand in South Palm Beach, Fla.
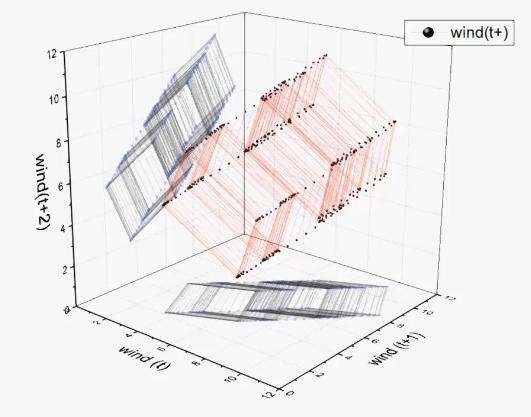
“Our research showed that wind speeds in the recently proposed Sugarland Wind project—the first utility-scale project proposed in Florida—follow strong temporal patterns that match up well with regular daily and seasonal electricity demand patterns,” reported Dr. Huffaker. “This was a huge breakthrough. Origin’s 3D graphing capability was instrumental in demonstrating that the data are systematic.”
The resulting data and graph, produced with the help of Origin software engineers, revealed wind is not random, but rather systematic and similar to a satellite’s orbit. View the 3D graph here:
http://originlab.com/index.aspx?go=SOLUTIONS/CaseStudies&pid=2103
“Dr. Huffaker contacted OriginLab after exhausting all his flat, two-dimensional graphing options,” said Snow Li, Technical Support Manager at OriginLab. “While the data was impressive on its own merit, it needed 3D animation to be graphically represented for full effect. Our technical support engineers wrote an animation script for Dr. Huffaker that he could plug into his Origin software, creating a 3D graph that gives the data a breezy motion reflective of its subject matter.”
Introduced in Origin version 9.1, 3D graph animation is used to show a trend in a series of graphs, allowing for real-time analysis and comparison of results. The animated LabTalk script created for Dr. Huffaker and Dr. Bittelli showed the evolution of patterns in their wind-speed data in elegant, ultrafast, flexible 3D motion. The researchers required a unique data display technique as their nonlinear dynamic analysis is an untested approach to wind power evaluation and differs from conventional approaches to analyzing wind-speed data, which remove patterns before systematically restoring them after the experiment is complete. Origin software afforded Dr. Huffaker and Dr. Bittelli the versatility needed to accurately display their findings.
OriginLab
www.originlab.com
Filed Under: News


