By David Clark, President
CMS Wind
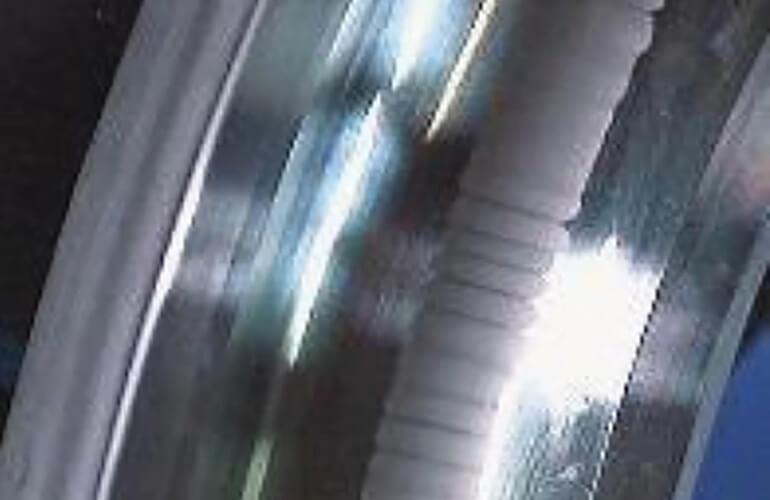
An electrical current that discharges through a bearing produces damage of this sort called fluting.
The purpose of condition monitoring is to predict failures. Vibration condition monitoring, when configured correctly (and most are not), gives a lead time to failures from 6 to 24 months on major drivetrain components. You may ask: How is that possible? It turns out that each component emits a vibration relative to its condition.
A good bearing for example, will not emit a particular vibration at a high level. A bad bearing will. When configured and monitored correctly using vibration condition monitoring, this emitted vibration is measured relative to heath of that component.
Unfortunately, there is a common misperception in the wind industry that a baseline vibration is essential to understand whether or not a component is failing. Tire pressure provides an analogy that might be helpful. For instance, do you need to know the tire pressure when you drive your car off the dealership? Of course not. You know when a tire goes flat.
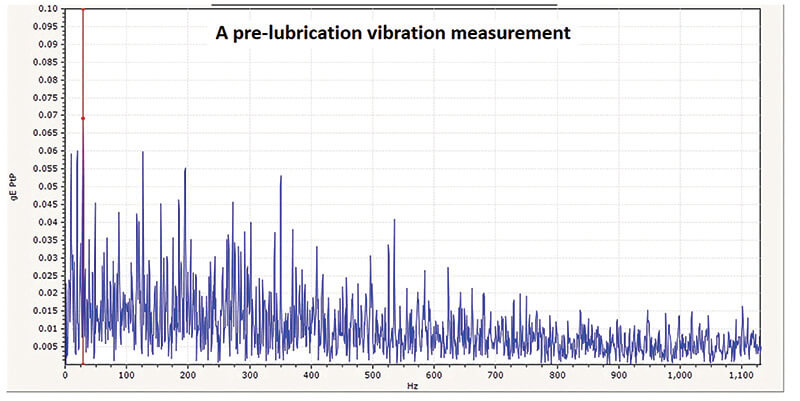
The vibration signal comes from a generator bearing in a wind turbine after some period in service and before a lubrication. All graphs here plot an instant of vibration versus frequency.
While this trend example is not a perfect analogy, there are a few non-standard trends in vibration that are quite helpful from an O&M perspective.
Lubrication trends
One of the most commonly measured vibration signals tells of a lack of lubrication. This is particularly common in generators and main bearings where lubrication is essentially predicated on interval maintenance. How widespread of an issue is this?
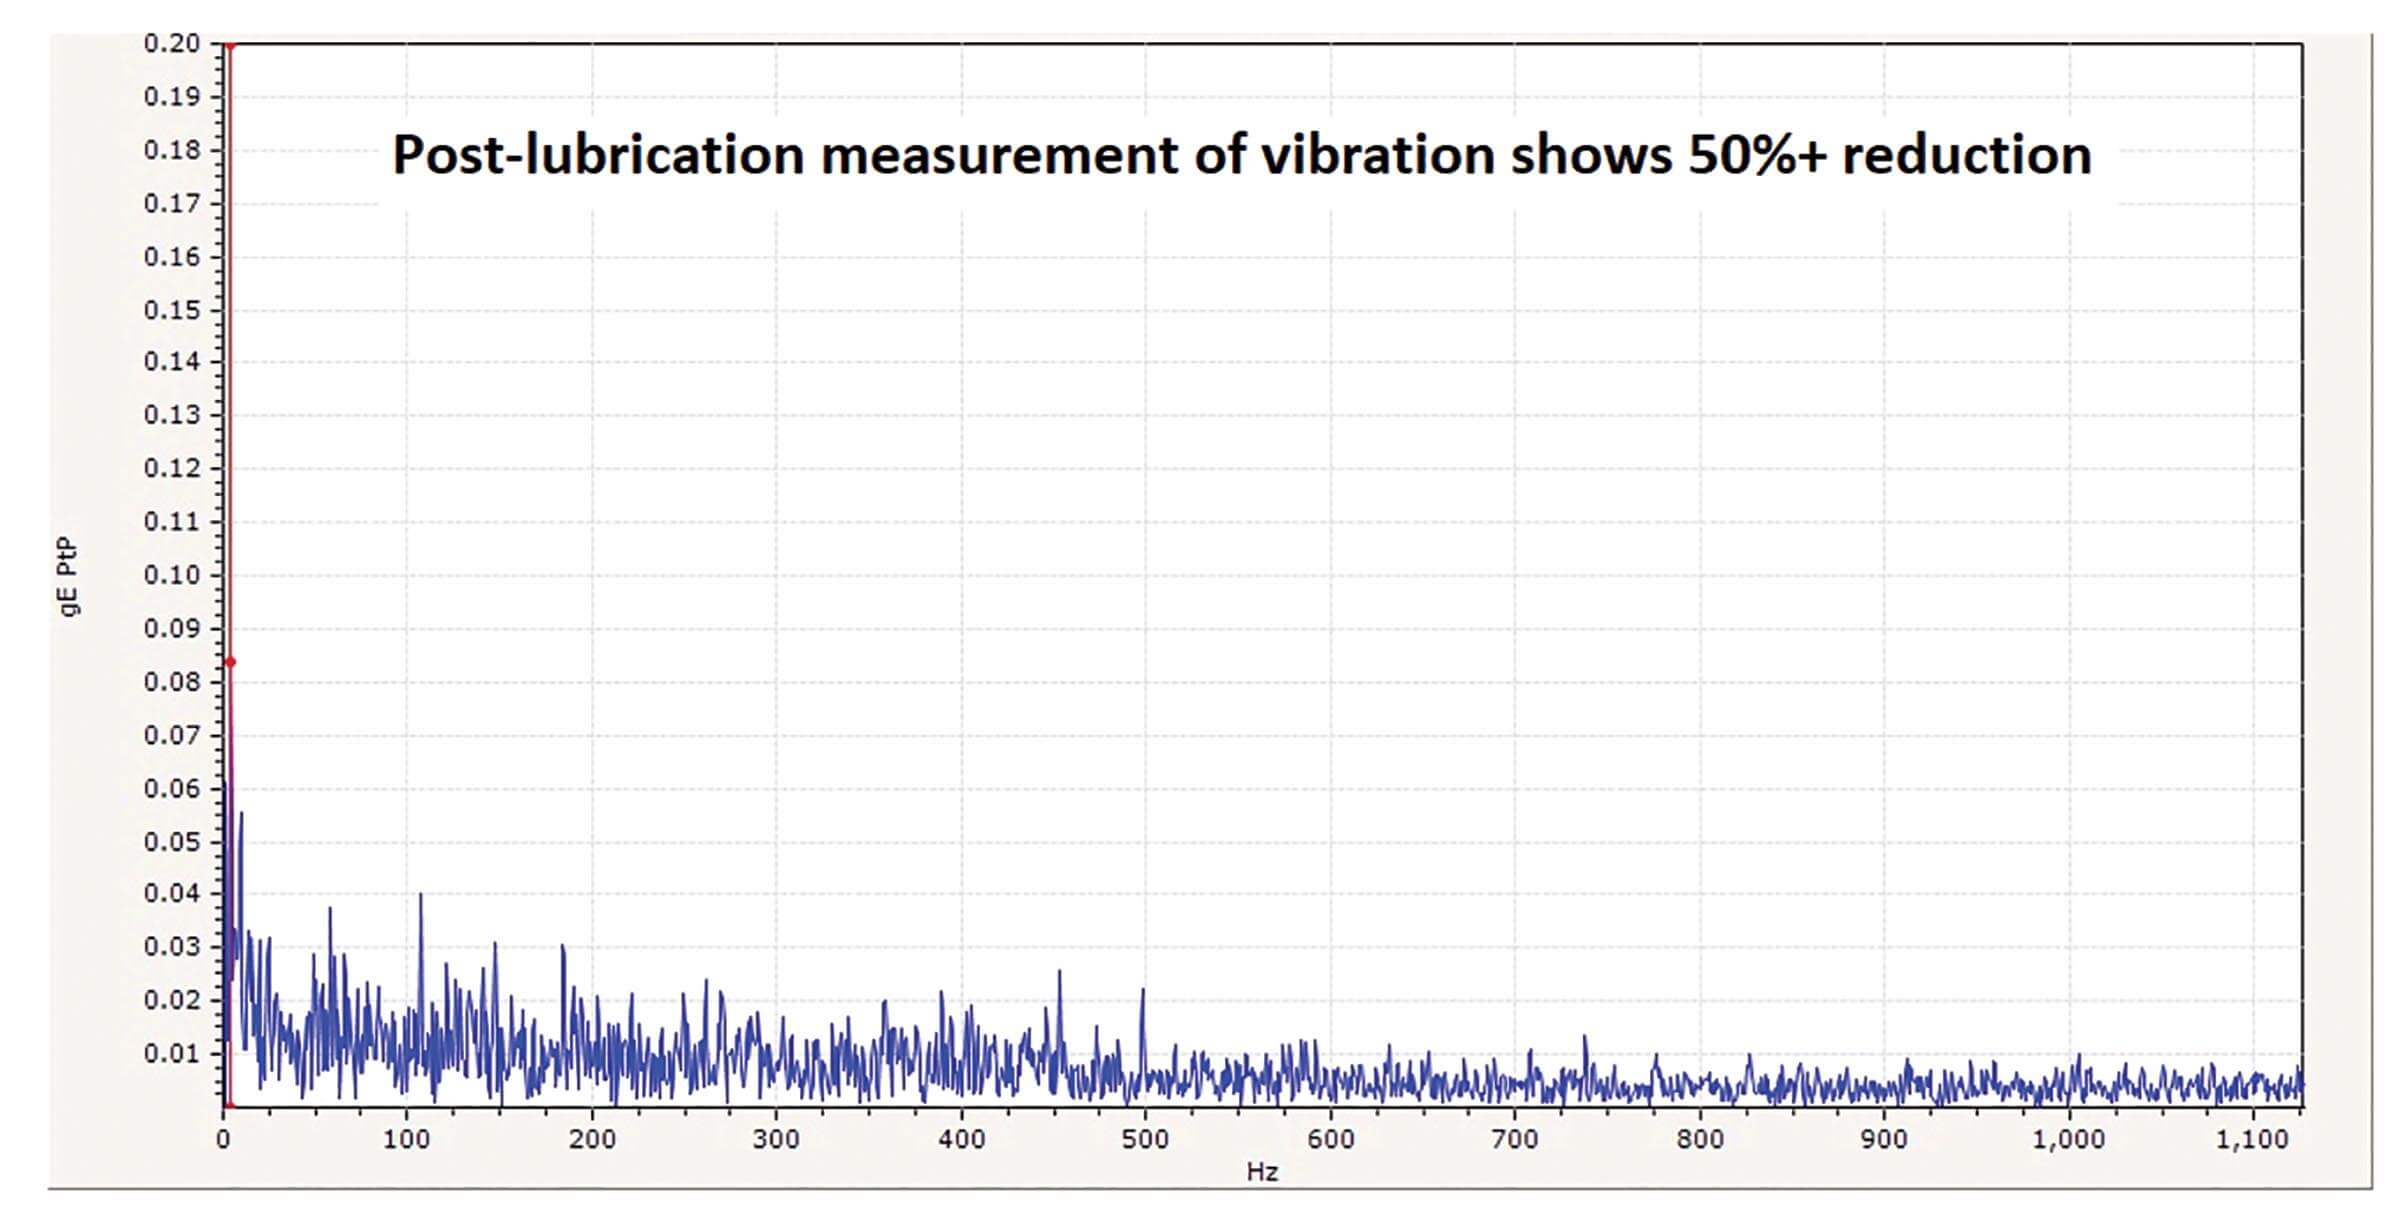
The same bearing from the previous plot after lubrication. It shows a significant reduction in vibration.
Of the gigawatts of turbines currently monitored, most every site has a widespread lubrication problem. In the illustration, A pre-lubrication vibration measurement, vibration sensing has detected a high level of bearing vibration so a check of the lubrication interval was suggested.
The next scheduled lubrication was not overdue. You can see on the graph, Post-lubrication measurement, that lubrication did in fact initially reduce the vibration. A second application was needed as indicated by the second peak in the vibration trend.
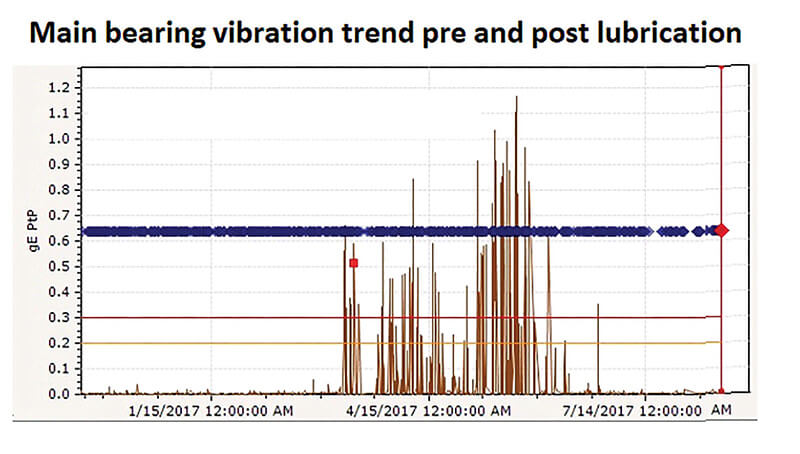
Finally, after the second application of lubrication, the generator bearing vibration returned to normal. Observing the trend could let an O&M team avoid a nearly $80,000 charge for a new generator bearing. Several other generators on this particular site also displayed similar vibration characteristics. The chart, Vibration trends pre and post-lubrication, shows a representative wind farm and its vibrations.
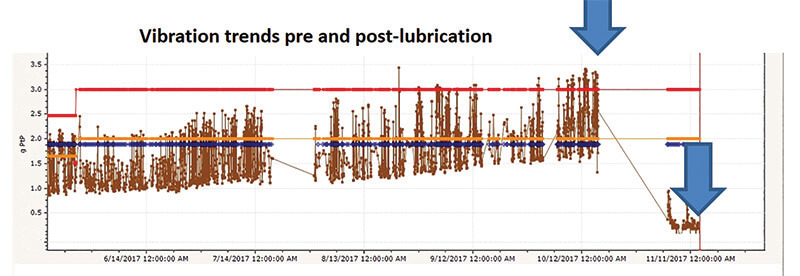
The brown plot indicates high vibration in a bearing. With sufficient time, it’s easy to see a trend to greater vibration. (A trend, however, is not needed to determine that a vibration if too high. The orange line indicates an alert level while the red line indicates an alarm level. At the first blue arrow, the turbine was taken out of service for maintenance and returned sometime later at a vibration level lower than when the plot began.
It turns out that most vibration measured relative to the drivetrain health is towards the back half of the wind turbine, toward the generator. Most turbine models follow this same failure distribution as the higher the speed, the faster, and more frequently these components fail. That means on average, a main-bearing failure trend will take 24+ months to fail at 16 rpm. While the generator bearings will take 6+ months at 1,400 rpm.
Post repair trends
This is very basic. Vibration that measured high prior to repair should trend to a normal vibration level post repair.
The vibration from a main bearing indicates a lubrication problem.
Transient operational vibration trends
In this newer age of mining SCADA data for improvements in production, it is surprising how much CMS (condition monitoring system) data is available from properly configured systems that would assist with improvements.
While there are limited SCADA data inputs relative to accurate health prognostications, there are specific data inputs in CMS that illustrate loads and trends. Vibration-trend measurements make it easy to see spikes in component vibration under certain operating conditions. Here is what must happen to make better use of vibration data:
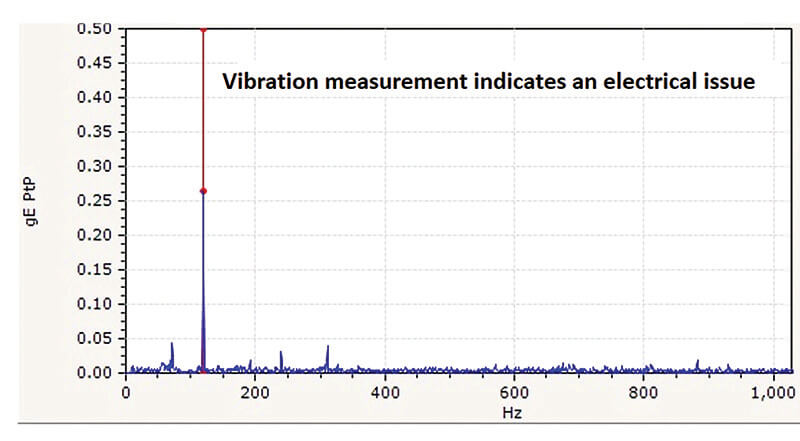
Vibration peak indicates an issue in the generator. Further electrical testing is needed to determine a root cause.
Correlate vibration data with operational data
The controllers in steam and gas turbines are preprogrammed to avoid critical speeds and resonances. These known operating conditions result in high vibration. There is room for the same approach in the wind industry given the ability to understand detrimental vibration under specific controller conditions.
Variables, such as pitch, yaw, and others create detrimental component vibration. There are a few considerations. For example, these vibration signals are specific to a component. As evidenced by these trends, certain operational conditions impact specific component health.
Hence, measurement trends capture two unique vibrations: one under specific operating conditions and a vibration specific to a component. For example, vibration measurements should show a significant spike in the main-bearing vibration when a yaw angle deviates from the wind direction. The spikes arise when the yaw deviates more than 6° on some towers.
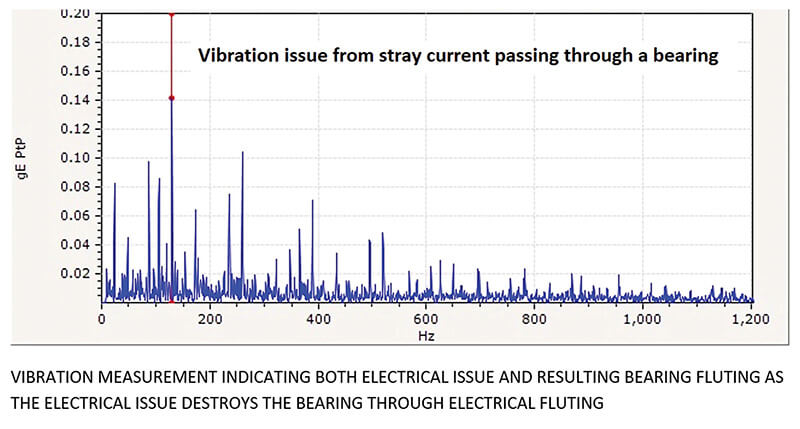
The vibration signal indicates an electrical issue and bearing damage from fluting, a condition that occurs when a stray current discharges through a bearing.
That means a nacelle misaligned with the wind direction generates a load that imparts undue stress to downwind components. Vibration also measures this periodic spike in vibration in the rest of the drivetrain.
Generator test trends
Of the drivetrain failures, nearly 50% are located in the generator. Of these, about 66% manifest themselves in bearing failures. While these are easy to see and predict in condition monitoring data, the other 33% of failures are electrical in nature and less obvious.
However, vibration condition monitoring, when done correctly, can detect these failures in a general sense. Specific electric tests can point to subcomponent failures.
These tests take little time per generator and are trend-able. For example, surge, partial discharge, polarization index, resistance tests are all trend-able and helpful in determining failures in the generator windings, insulation, and wire.
Filed Under: Components, News, O&M


