Steering turbine wakes by controlling yaw and seeing real-time measurements of wind flow through a wind farm are just two ideas and developments from Sandia’s recent reliability workshop.
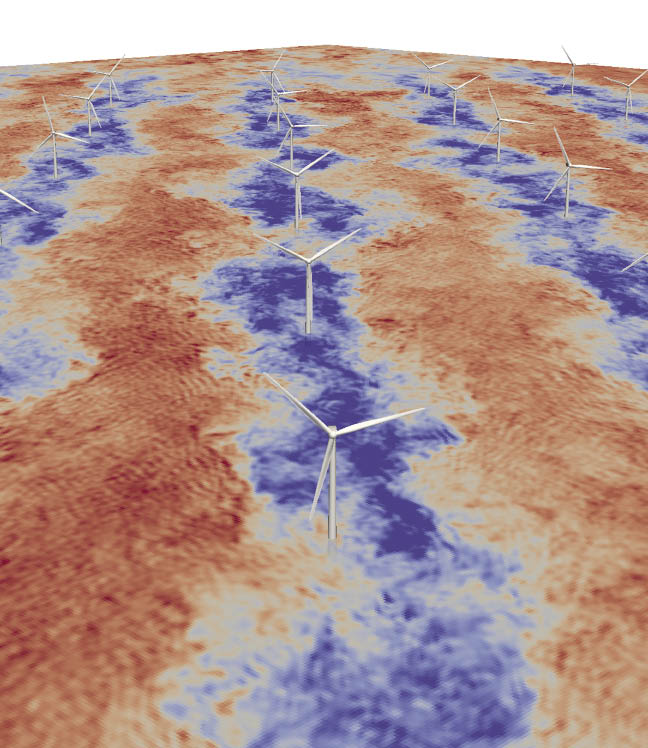
NREL’s simulation is of an offshore wind farm between Denmark and Sweden
consisting of 48 Siemens, 2.3-MW turbines. All turbines in the simulation spin at real rates. Wakes are complex and low-speed regions. The wakes meander and increase down the row of turbines. The simulation also shows how wakes influence production of other wind farms downstream.
The complex interactions of wind with many turbines across a large wind farm are not difficult to imagine but a dickens to confirm. During one session at the Sandia Wind Plant Reliability Workshop, presenters reported on their success showing what really happens in such flow. NREL’s Patrick Moriarty provided an update on his Lab’s work to provide useful and insightful large scale models of such wind flow while Texas Tech’s John Schroeder showed similar and stunning real-time-radar visualizations of the flow across a Texas wind farm on complex terrain. The work of each presenter complimented that of the other and provided ideas for designing and operating more productive wind farms.
The model
The great advantage of an accurate computer model for any design is that you can play with the inputs and evaluate the outputs. For a wind farm, inputs could be wind speed and direction, turbine locations, terrain surfaces, even rotor diameter and yaw.
These simulation tools have been a long and daunting development, but recent efforts generate great images that make complex flow visible and more easily understood. “It’s almost as if we added a dye into the wind that changes color with speed,” says Moriarty, commenting on the video he presented. “The images show high winds in red or hot colors, and slower winds speeds in blue, and how well downstream turbines are working. The view goes all the way up to mesoscale, for 100s of kilometers along with power production and fatigue load calculations.” This work allows examining variations that impact the lowest cost of energy or LCOE.
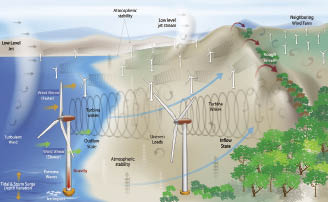
Complexity in wind flow comes from many sources. Source: eere.energy.gov
The problem of current models, says Moriarty, is that they lack the physics that describes the atmosphere. His team wants to better understand the atmosphere and its interactions with wind plants to further develop models that replicate it and then validate it with actual measured data.
From the developer’s perspective, complex flow models would assist in calculating a 20-year performance estimate for a proposed wind farm. Accuracy so far has been probabilistic – a bell curve. But compare the Gaussian distribution to what is actually happening in the field and a different story emerges – lower power production, which leads to the issue of underperformance on average, about –9%. For a million-dollar estimated power production, that bias is too great. Every year brings a different production value.
Uncertainty also comes in part from imprecise wake modeling. There are all sorts of questions on wake modeling, such as what atmospheric stratification exists and where are they located, along with turbine reliability, and downtime. “So a better understanding of how wind flows should let us reduce bias along with uncertainty,” he adds.
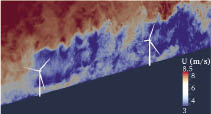
The NREL model allows slicing and dicing its information several ways. The downstream plane between two turbines gives a look at wake height. Notice the higher speed air above the turbines.
What has been known for a while, he says, is that under certain atmospheric conditions, turbines are getting beat up by what’s called a mildly stable atmosphere. “Even though this has been known for a while, we don’t know exactly what is happening in the flow that influences damage events” says Moriarty.
The approach taken by his research group to solve the problem of modeling complex flow across a wind farm model comes in an NREL developed program that he guided: Simulator fOr Wind Farm Applications or SOWFA, pronounced sofa. “The simulator is open sourced so interested parties can download it. It couples three different codes: FAST for modeling individual turbine drive trains, towers, and blades.
Its output goes into a CFD simulation (OpenFOAM) that calculates atmospheric boundary layers, and in turn is driven by a large scale weather model that drives wind farms with large structures, such as turbine arrays that generate all kinds of interesting effects,” he adds. All calculations are performed on high performance computers with a few thousand processors. The ultimate goal is to better understand what is going on in complex flow, how the turbines are reacting, and then guide build campaigns and take better measurements. “That means the video I showed is not just a pretty movie. It is validated with real power production data,” says Moriarty. His team has been collecting 10 min SCADA data along with inflows and wake measurements from Lidar.
To point out the possibilities of the model, consider the gap in one row. It looks like a turbine is missing. A plot of wind speed down an adjacent row shows that the power levels-off with downstream turbines, which is typical. But in the row with the gap, power increases for the turbine after the gap because it’s receiving more energy.
“What is also interesting but not obvious is that turbines furthest downstream are the ones most highly loaded. That may mean the turbines in wakes of others will have more maintenance and reliability issues,” he says. Another simulation showed a turbine with a wake along with instantaneous turbine loads and effects on the structures and how each turbine interacts. At one point in the animation, wind changes direction and the wake moves away.
What to do with a good model
Moriarty’s report confirms observations and some suspicions. For instance, Julie Lundquist, a researcher with Moriarty’s group and a joint appointment between NREL and the University of Colorado, has shown that crops that surround a wind farm affect energy capture. Corn is tall and so reduces the energy capture versus soybeans which are closer to the ground. “And then there is the unanswered question of how wind turbines affect the crops,” says Moriarty.
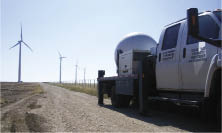
One of John Schroeder’s radar trucks based at Texas Tech University is set up for single Doppler scan at a Texas wind farm. A single radar can generate 2D information. Two trucks working as a dual Doppler system are capable of 3D measurements
An accurate model ultimately leads to more productive wind farms. Recent proposals are to use lidar and adjust turbine controls based on wind inflow, to extract as much energy as possible.
 Although tuning a wind plant is difficult, Moriarty’s simulations suggest adjustments. “We have run several simulations, for example, that de-rate (reduce the power) the first row to let more energy through. That works under some conditions. And then there’s wake steering, moving a wake. Changing the yaw on one or more turbines allows controlling where the wake flows, ideally away from downstream turbines. Depending on yaw angle, results show a 4.5% increase in energy capture.”
Another idea: A hub-rotor design with tilting blades. To avoid tower collisions, most turbine rotors have a blade tilt of about five degrees away from the tower. Now imagine a turbine with a downstream rotor that can tilt its blades, sort of fold them toward a center line. This would allow driving a wake into the ground and thereby pull more high speed flow from the upper atmosphere into the next row of turbines. “Blades tilted at 33° from vertical in the simulation produce up to 7.1% more power. Of course, in a simulation tool, you just change a number,” says Moriarty. He acknowledges it’s a bit more complicated in hardware.
And then, moving turbines out of a row by one-half rotor diameter has shown possibilities. “It is easier if the turbines are floating offshore or on tracks onshore,” he says.
Moriarty admits these adjustments also change loads on turbines. Power adjustments could reduce loads on downstream turbines, and hence reduce overall fatigue and maintenance costs. “We need to better understand the relation to energy capture and loads. There is lots of potential for new design concepts in controls. The yaw control, however, could be implemented in any wind farm right now,” he says.
Schroeder’s radar equation
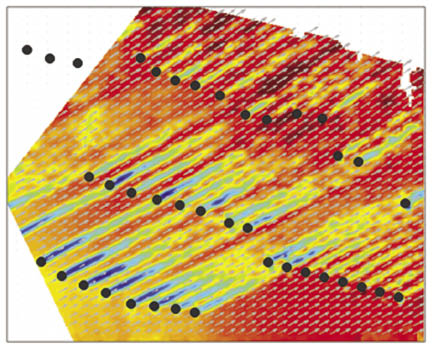
The real-time plot is from a single-Doppler scan and calculated for hub height. Wind shear grows by a significant amount and the wind speed changes with time along with the wake. There is an edge effect along with complex terrain to the upper right of the farm. Notice too the high speed channels between turbines.
How complex is complex, asks Texas Tech Professor John Schroeder. “Wind farms are impacted by all sorts of things, including transient gusts and lulls, differences in ground cover, complex terrain, and atmospheric instability. At night there can be tremendous shear so the atmosphere can be different at the top and the bottom of the rotor sweep, and then there is directional veer, too. All these things on any day can significantly change wind farm output,” says Schroeder. Then look inside the farm and it gets even more complicated.
“We think there is a lot of opportunity here to reduce the cost of energy by learning about this complex flow,” he adds. “So the big push is to measure it. There have been a number of efforts using SCADA data from turbines or individual meteorological towers, but those only lead you to a small part of the story,” he says. For instance, it’s almost impossible to do things such as separate wake width from wake meandering using the existing data sets. Other attempts have used sodar and lidar to measure profile changes up and downstream of turbines, but these too are limited. Scanning lidar technology typically gives adequate resolution and allows some measurements of turbine wakes.
“At Texas Tech, we have come at the problem from a different perspective. For years, we have been developing radars to let the wind community better see complex flows. Radar advantages include good resolution, and we need high resolution maps of the wind with enough range to get away from looking at just one turbine. The goal is to examine the entire wind farm,” says Schroeder.
The product of Schroeder’s 10 year effort is two truck-based radars developed, built, and recently upgraded with improved signal processing. “The first radar in 2011 let us start looking at things in complex flow. The second radar lets us take additional measurements and supports dual-Doppler synthesis,” he says. The truck-mounted radars can go to almost any wind farm to collect data.
“Peak transient power is 212W, not a lot. But we can send out a relatively long pulse, get a return, and with fancy signal processing retain resolution,” says Schroeder. The range resolution, about 9 to 15 m, depends on the engineered pulse. This lets two radars work together to create wind maps across a large region of a wind farm along with useful 2D planes of information, as in the accompanying picture.
Resolution is sufficient to see the wakes. “Sometimes we can track it for over 35 rotor diameters downstream. A simple wake-tracking algorithm goes out 15 rotor diameters,” says Schroeder. The advantage of a single-Doppler strategy is a rapid revisit time, updated every few seconds. Put two radars together and that information can be combined to build a whole horizontal wind vector, even at hub height.
“Of course the real target of these studies is entire wind plants, so we went to a wind farm in West Texas and used two radars to scan a region with about 36 turbines. The update rate is about 60 sec because the system is combining several different elevation angles and lots of information from both radars to get a complete view of the wind at hub height,” he says.
A lot of things can happen during one 90-minute array scan. From a video he presented, edge effects become apparent, as do changes in the middle of the array between the wakes in the form of high-speed channels. While showing the video, he says, “I have to remind people that this is not a simulation. These are real measurements from two different radar systems operating simultaneously.”
The analysis of measurements shows expected and unexpected events. For instance, wind speed is increasing with height. No surprise. But here is a surprise: at about 200m up, the wind veers about a 10° from the predominant flow lower down. Compare that to another cross section behind a second row of four turbines and you see wakes coming from the front row impacting certain turbines. “We also see an induced rotation of the wakes downstream of the turbines due to the rotor,” he says.
The measurements allows a variety of analyses such as taking a cross section from any angle – one that runs through three different turbines, for example. “It’s possible to see the first wake from the front row turbine impacting the second rotor along with the entrainment of the higher velocities from above that drifts down. A third turbine wake moves off terrain and looks different. Another possibility is to take a cross section sideways through the array and look at all the different wakes and all areas of acceleration.
Look at streaks between wakes (turbine rows) and you see there is more momentum available there flowing through the wind farm. Then look atop the rotors and everything seems to accelerate above the wind farm. There is a lot of momentum aloft that potentially could be captured.
Lastly, with so much information, it’s possible to build ideal inflow characteristics. We can go one diameter upstream of a turbine and extract information such as the wind speed at hub height or an effective wind speed across the entire rotor.
And with the turbine outputs, because wind speeds are available, it’s possible to build power curves, and then to compare the power predicted versus the actual produced. It’s no surprise: They don’t match under every circumstance.
There are lots of ways to look at this data. “In initial assessments, we’ve located wake structures, turbine-to-turbine interactions, watched transient gusts move through a wind farm, and watched the power drop off within the turbines. So far, data from the dual-Doppler setup compares well with turbine data. And this capability is just getting started,” he adds. This measured data will add a catalog of information to improve wake modeling efforts and farm layouts. WPE
Your wind research lab is ready
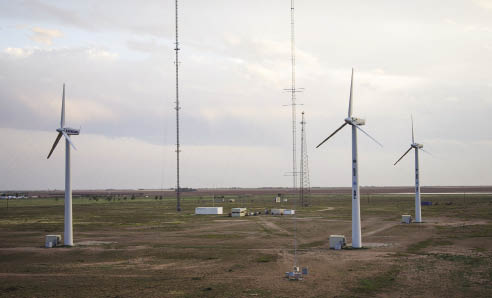
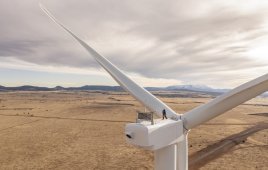
Sandia’s SWifT facility in west Texas has three turbine up and ready for experiments. The rebuilt Vesta units have new drive trains and open-sourced controls for easy adjustments and tests. Director John White says the facility is open to serious component developers who would like to test their equipment and ideas in the real world. The finished facility will have about 10 turbines arranged roughly in a square.
Another presentation during the Sandia Workshop included an update on the Lab’s SWiFT facility in West Texas. The DOE, Sandia, and Texas Tech University recently commissioned the facility at the Reese Technology Center in Lubbock. Sandia’s John White says it is the first public facility of its kind to use multiple wind turbines to measure how they interact with one another in a wind farm. White said the facility is open to component manufacturers wishing to test new products.
White, the technical lead for the project, says SWiFT is the first moderate-scale facility — allowing up to 10 wind turbines — to investigate, test, and develop technology for wind plants. “Some estimates show that 10 to 40% of wind energy production and revenue is lost due to complex wind plant interaction,” he says.
The facility allows for rapid, cost-efficient testing and development of transformative wind energy technology, with specific emphasis on improving wind plant performance. The facility’s advanced testing and monitoring will help researchers evaluate how larger wind farms can become more productive.
Researchers have begun planning the site’s first research projects. Two projects for next year will test and evaluate Sandia’s new National Rotor Testbed Project and collect baseline data for turbine-turbine interactions that can be used by the international community to improve wind plant performance.
Filed Under: Featured, Turbines