Jigar J. Shah, Senior Researcher, Envision Global Digital Energy Center
Wind energy would be much more plentiful if wind turbines could be placed in one long row always facing a steady wind direction. In reality, multiple constraints (e.g. land, environmental, financial, engineering) usually dictate placing turbines in several rows and closer together. Unfortunately, this results in lowered energy production from downstream turbine rows.
This lowered energy production can be explained by the wake effect. A wake refers to the reduced wind downstream of a turbine after extraction of energy by an upstream turbine from the incoming wind flow. This is further characterized by increased turbulence and gradual mixing as the stream tube expands downstream of a turbine. This iconic photo captured in Denmark at an offshore wind farm illustrates this effect at work.
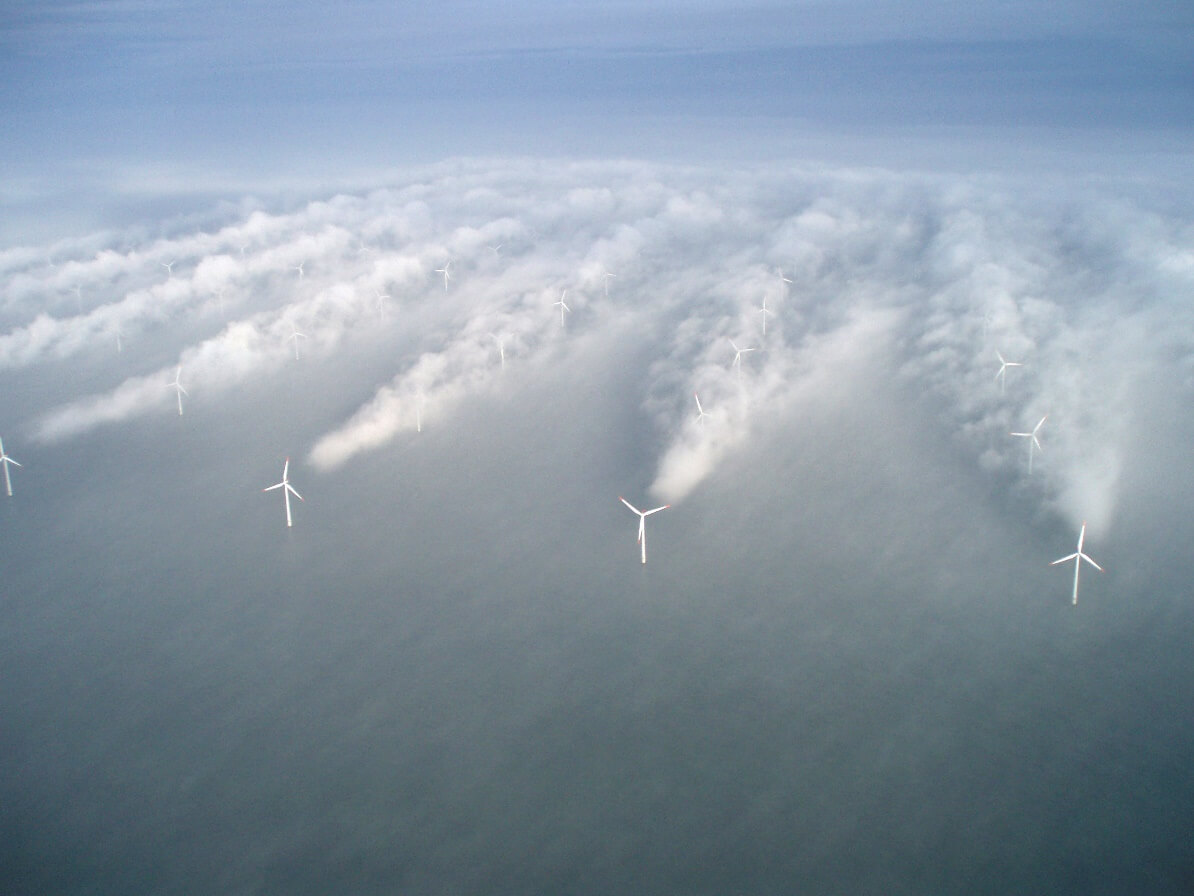
Photo by Christian Steiness / Vattenfall (Horns Rev Offshore Wind Farm, Denmark)
Original Image Link: http://i.imgur.com/qruVcnu.jpg
Why does this matter?
Given that all turbines at a wind farm cannot extract energy from undisturbed wind in all directions, on the order of 10% of Annual Energy Production (AEP) or higher can be lost due to these effects, depending on the layout. Fatigue loads from turbulent flows are another concern. Reducing wake losses could make wind energy more attractive and lead to increased penetration in the energy market.
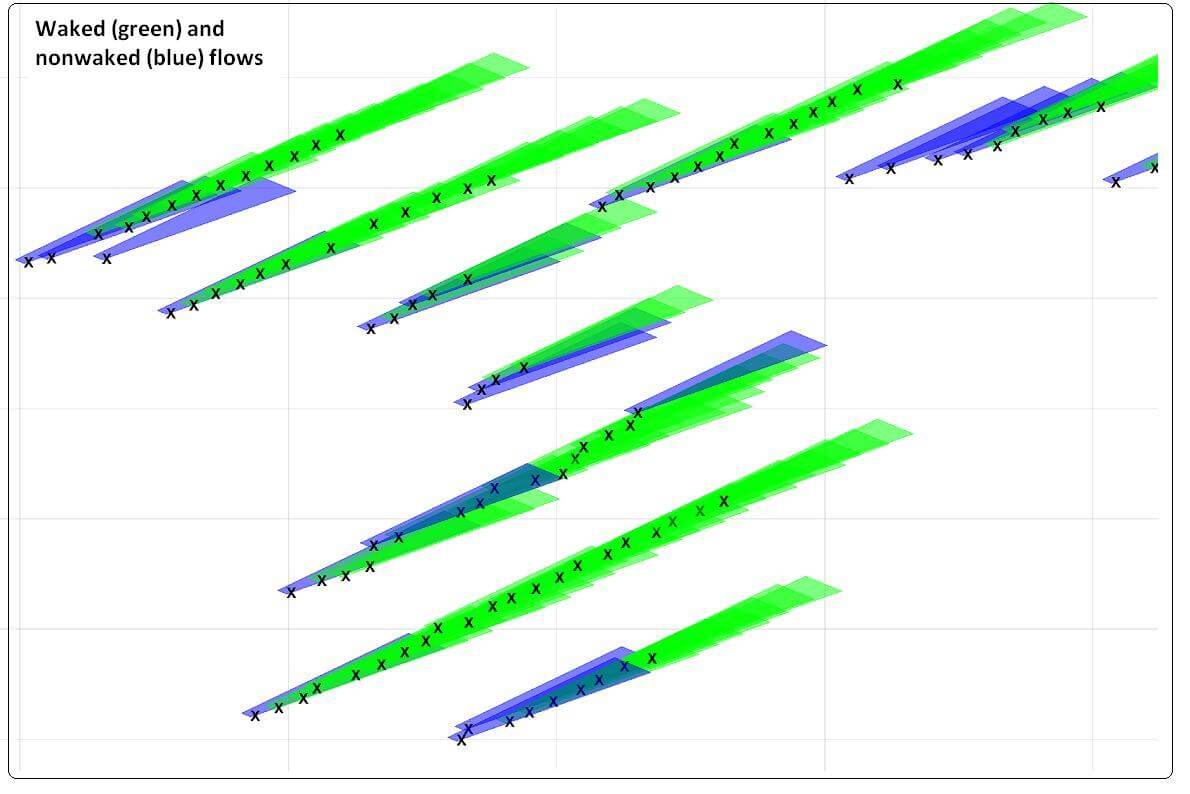
The simulation is for a low-fidelity Park model (N. O. Jensen, “A note on wind generator interaction,” Tech. Rep. Risø-M-2411, Risø, 1983.). It shows the number of turbines waked for this layout when wind is from the southwest. Blue is for non-waked turbines and flow, and green, waked turbines and flow.
The simulation snapshot above shows a low-fidelity Park model (N. O. Jensen, “A note on wind generator interaction,” Tech. Rep. Risø-M-2411, Risø, 1983.) and the number of turbines waked for this layout when wind is coming from the southwest. Each turbine is marked by an X, with the blue representing turbines with undisturbed production, and green showing waked production. Given the significant levels of waked energy production, this ‘railroading’ scenario is a prime example of why wind energy generation is variable and often times at the mercy of Mother Nature.
What can we do about it?
Turbine controls today produce the maximum energy possible for themselves. They have no ‘concern’ for turbines around them, and this is often referred to in industry as a ‘greedy’ approach. Wake control can work towards a global optimum of energy generation at a wind farm.
Envision’s Energy OS platform is used to manage more than 50 GW of renewable energy assets worldwide.
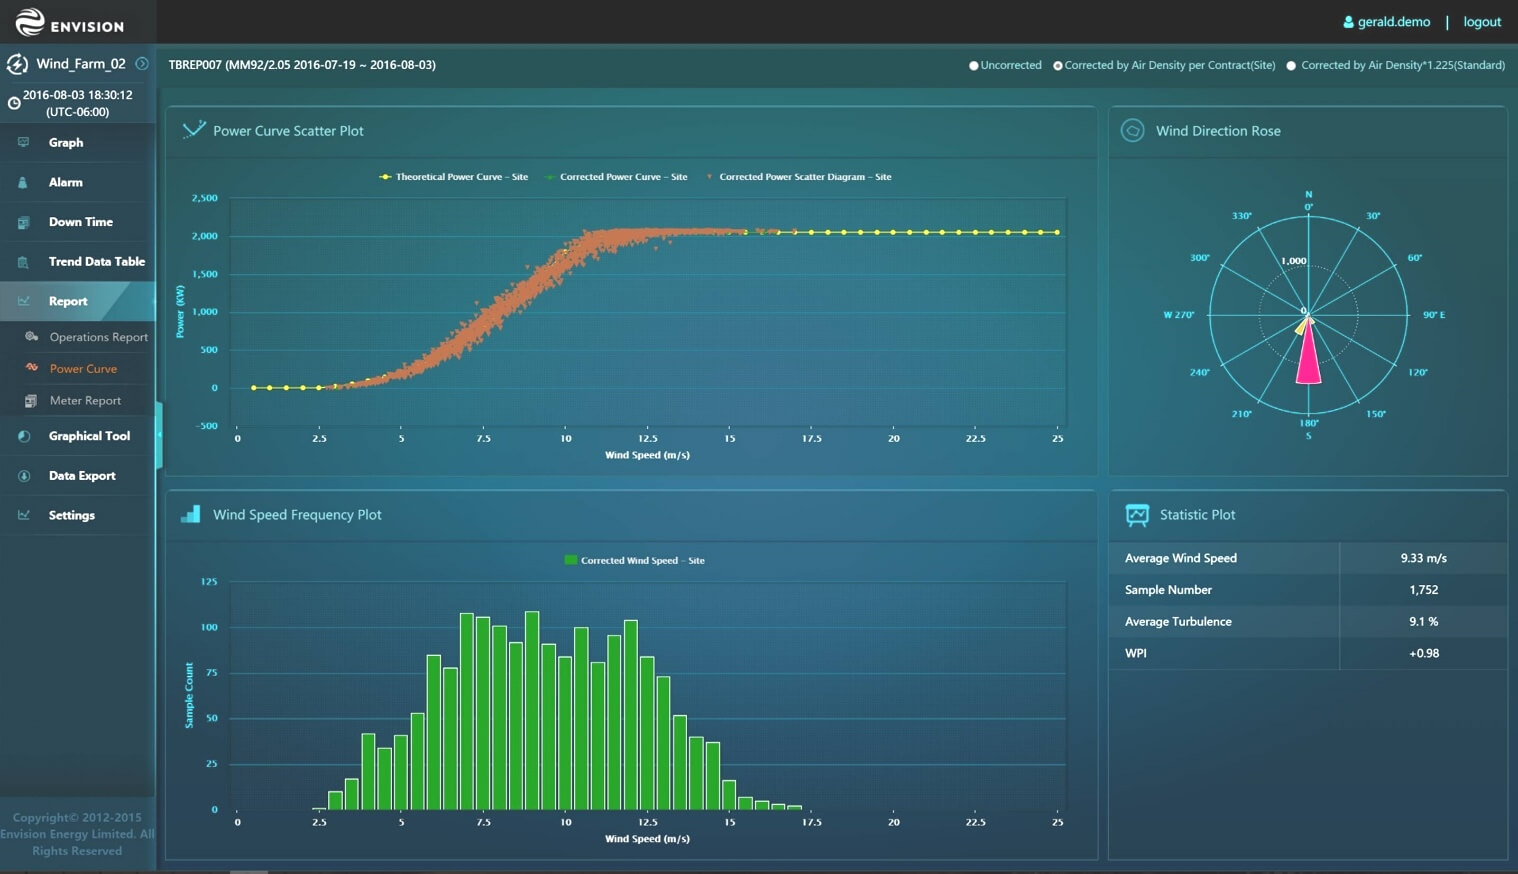
Envision’s smart energy management software unites data from every asset to enable alerts, control and monitoring from a streamlined interface. This screenshot, from Envision’s wind farm solution module – Wind OS, allows for examining the real-time performance of each wind turbine on a farm, regardless of manufacturer. The top left shows the actual production in red with respect to the theoretical power curve in green, while the top right shows the predominant wind directions followed by the wind speed frequency distribution at the bottom. (www.envision-energy.com/)
While theoretical models and CFD-based (computational fluid dynamics) approaches exist, data is king. So, how can Envision’s smart energy management software leverage cloud-based multiple-manufacturer asset data and physics-based algorithms to improve the output of the entire wind farm as a whole?
What can we control?
There are a couple of mechanisms we have at our disposal to work towards a global optimum. Here are a few examples:
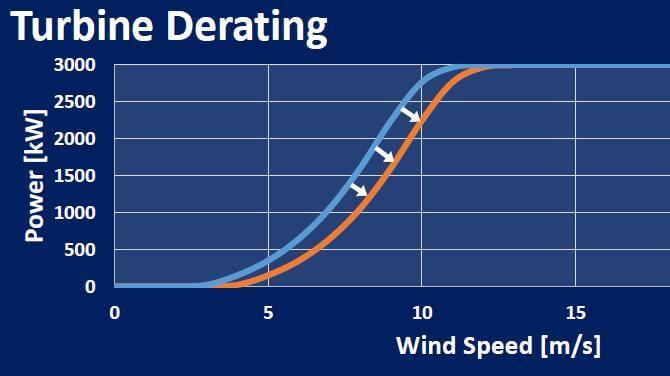
Pitching the turbine blades is one way to reduce power production.
Reducing power production is one way to regulate thrust extraction via pitching. Doing so does not impact turbine safety-critical systems and can be implemented using existing protocols for curtailment. It also has a lower cost to market. However, reducing power output does not directly control thrust extraction for wake management.
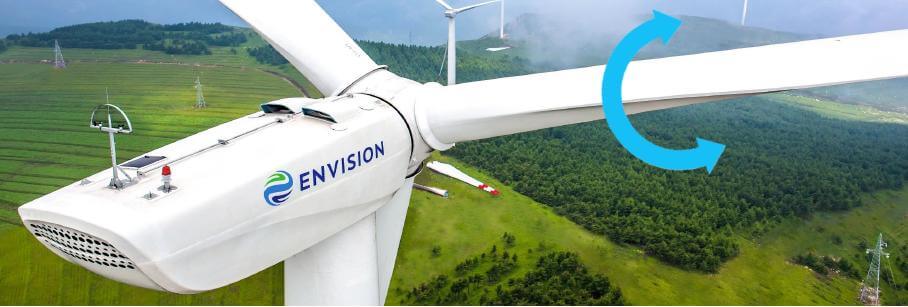
Adjusting the angle of the blade (pitch) to the incoming wind can decrease thrust extraction, allowing more wind to flow through.
Varying the angle of the blade (pitch) to the incoming wind can decrease thrust extraction, allowing more wind to flow through. This directly impacts the downstream wake and allows the controller to maintain the angle under changing wind conditions. However, it can impact safety critical systems and may require manufacturer (OEM) controller changes and redesign.
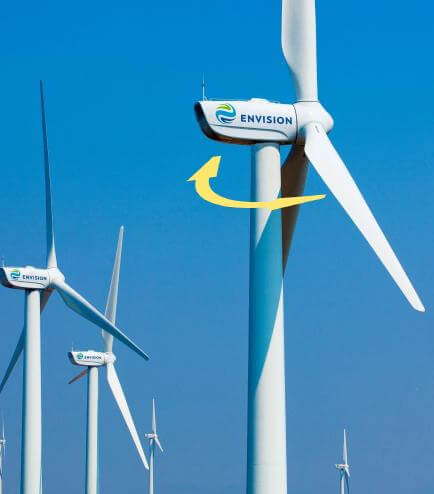
Rotating the nacelle position slightly out of the wind can redirect the wake.
Turbine yawing is another possibility. Simply rotating the nacelle position slightly out of the wind can redirect the wake. While this works effectively to manage wakes for closely spaced turbines, it requires controller modifications to allow for external yaw adjustments. It may also produce asymmetrical fatigue loading on turbine components throughout the wind farm.
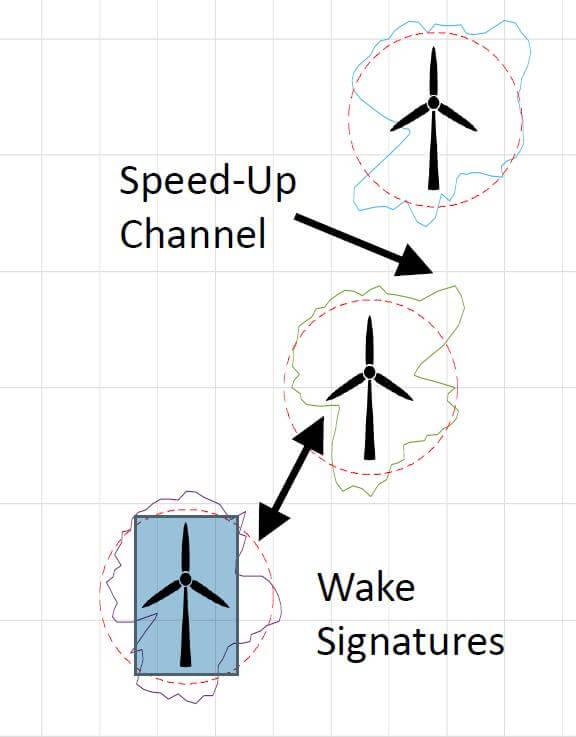
The dashed unit circle indicates normalized power production in each wind direction. The solid-lined plots around these unit circles illustrate each turbine’s production relative to this metric.
Envision has been experimenting with several promising techniques for characterizing and managing wakes.
One such technique is leveraging Supervisory Control and Data Acquisition (SCADA) data to perform a directional analysis. In the accompanying image, a dashed unit circle indicates normalized power production in each wind direction across the wind farm. The solid-lined plots around these unit circles illustrate each turbine’s production relative to this metric. Wake signatures and speed-up channels are apparent through the annualized 10-minute SCADA data analysis. While wakes are primarily known for being ‘party poopers’, this analysis shows wakes can possibly be advantageously leveraged to increase production at times via speed-up channels.

Regarding the wakes and bar graphs in the image above: The numbers in the top box mark the layout for a few turbines on a particular wind farm. For the particular wind direction, the wakes from turbines 1 to 9 flow downstream to turbines 10 to 18, as indicated by the arrows. In the bottom box, the blue bars represent first turbine specified in the Y-axis and yellow the second turbine. Turbine 8 is offline and has no production. Total production in kilowatts for each row appears to the right of the bars, followed by a ratio of the downstream turbine’s production relative to freestream power. (Hence, for turbines 1 and 10, their total production is 1,497 kW. Dividing downstream turbine 10’s production of 948 kW by the freestream power of 656 kW gives a ratio of 1.45). The freestream power is determined based on the average production of the first row turbines except for those offline or operating abnormally (e.g. excluding the production of turbines 4, 6, and 8 in this case).
To further study such effects, Envision is working with partners, such as Pattern Energy Group (http://patternenergy.com/), to leverage novel radar technology on the field. Ka-band radar allows measuring the actual wake propagation in all dimensions across time. For example, the yaw action of the turbine indicated via the black arrow in each 1-minute frame causes wake redirection onto a downstream turbine, significantly impacting its production. In a similar way, turbine wakes could be redirected in-between downstream turbines, allowing for increased production. A technique of this sort would allow tuning an entire wind farm for its maximum output versus tuning every turbine for itself.

The colorful radar images come from Texas Tech University National Wind Institute / SmartWind Technologies under contract by Envision.
Envision is in the process of using our insights from these efforts to commercialize enhanced wake analytics, implement novel wind farm control approaches, and facilitate continued research.
For further information on this work and Envision’s services contact:
Jigar J. Shah, Senior Researcher, Envision Energy USA Ltd.
jigar.shah@envision-energy.com
Filed Under: News, O&M


