Proper gearbox-oil analysis reveals a lot about the oil’s condition. The challenge comes when oil analyses reveal no problems but their gearboxes still fail. The right tests provide actionable information that leads to increased oil and gearbox life.
Kevin Dinwiddie / Wind Turbine Tribologist / AMSOIL Inc. / www.synwind.com

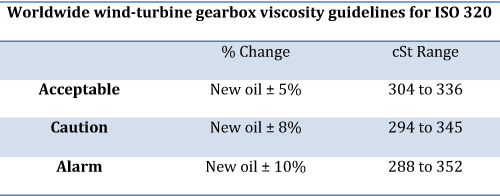
Worldwide acceptable viscosity ranges can differ document to document and are intended as guidelines used to help determine the condition of gearbox oil.
Wind-farm operators often say, “I perform oil analyses every six months and the report says everything is fine… but my gearboxes are failing. Why?” Simply stated, normal oil analyses can only detect iron particles approximately five microns in size or smaller and cannot detect larger particles that cause abnormal wear or poor gearbox health.
Reading and understanding an oil analysis report is an art. The picture is not clear until every piece of data is evaluated in conjunction with the whole. Routine six-month oil tests look at the oil condition, not overall gearbox health. Common tests include viscosity, additives levels, contaminants, total acid number, water, and cleanliness codes. In addition, a particle-count sample test can help determine gearbox health, but is somewhat limited. Each of the following categories affects the gearbox so it’s important to know what they are and how they impact the oil’s condition and gearbox life.
Viscosity
In a wind-turbine gearbox, the most common gear-oil viscosity is ISO 320 which is calculated at 40°C and reported as centistokes (cSt). If the viscosity decreases, the oil is shearing and there is potential for reduced oil-film thickness, resulting in increased wear. If the viscosity increases, it may be due to oxidation byproducts which can be associated with oil degradation and shortened filter and oil life. Worldwide, acceptable viscosity ranges differ slightly from document to document, although limits are tighter than in the past. The latest guidelines, from IEC 61400-41, are listed in the Worldwide wind-turbine gearbox viscosity guidelines for ISO 320 chart.
Additives
There are different types and quantities of additives in each brand of wind-turbine gear oil. To determine the condition of used oil, a comparison is needed between the additive baseline of the used and new oil.
Reduction or depletion of additives can be associated with excessive oil-service life or high water levels. Some gear oils are comprised of additives that attract water more than others. Oils containing additives that attract water in greater amounts may experience excessive additive depletion. In gear oils that accumulate excessive water, it is possible to deplete and filter out additive levels potentially causing reduced wear protection, foaming, and ultimately shortened oil and gearbox life.
When switching from one oil brand to another, it is important to flush the gearbox2 to assure that additive carryover is kept to a minimum. This ensures that the integrity of the new oil is not diminished by the original oil, and optimizes the performance and life of the new oil. If the oil change is performed without flushing, oil analyses on the new lube may reveal contamination from additives left over from the previous oil. Ask your oil supplier for a list of condemning limits which should include the acceptable amount of carryover additives.
Some gear oils have several different additives that show up in normal analyses, however, modern gear oils use additives that are more specific to wind turbines. Phosphorus is an important additive for anti-wear, micropitting protection, and extreme-pressure performance. There are many species of phosphorus. However, your oil analyses only reports phosphorus in general, and not by individual species. Some species of phosphorus deplete in the presence of water and others do not. Watching the phosphorus trend in your gear oil provides an indication of the quality of phosphorus used. If the trend shows no depletion in parts per million (ppm), even with water fluctuations from ambient conditions, the phosphorus is stable and will continue working to protect the gearbox.
Contaminants
Even in small amounts, contaminants can increase operating costs associated with maintenance expenses or gearbox replacement. The main contaminants affecting oil and gearbox life are water, wear particles, and dirt. Along with additive depletion, water can cause filter plugging, sludge formation, reduced oil-film thickness, and be difficult and expensive to remove. Some filtration systems will reduce the water level in oil but they tend to be costly. Another option to eliminate contamination problems is to change the oil to one that does not adsorb water.
Excessive wear particles cause reduced wear protection. Switching to a finer filtration, from 10 micron to five micron, either temporarily to clean up the wear particles and dirt or as a permanent equipment change, is a common solution to improve oil cleanliness. In some cases a 3-micron bypass filtration system can be used to reduce fine particulates. This filtration system, however, can reduce silicon used in some oils as an anti-foam additive and result in increased foaming.
Dirt is abrasive and shows up in oil analyses under the silicon column, but remember that some oils use silicon as an anti-foam additive. In this case, it’s best to establish the new oil silicon value and monitor any increase in levels which would most likely be dirt. If you suspect dirt in your oil ask your laboratory for a simple filter patch test and perform accordingly. Dirt in a filter patch looks like beach sand and is easily distinguishable.
A decrease in silicon from its original ppm is a likely indication that the oil’s ability to combat foam will also decrease. What’s more, foam can reduce the oil-film thickness and increase wear so pay attention to reduced silicon levels.
Total acid number
Each oil has a different starting point for total acid number (TAN) which is directly associated with additive content. A general rule is to condemn the oil when the TAN increases more than two points higher than the initial TAN. In this case it is best to consult your oil supplier for the new oil-TAN value and used oil-condemning limit. If the TAN increases and exceeds the condemning limit it may be an indication the oil is turning corrosive and may contribute to depleted additives and increased wear. Over time sulfur used in some gear oils as part of the extreme pressure additives can combine with water and oxygen and possibly lead to the formation of sulfuric acid. This can lead to corrosive wear which is just as damaging as rubbing wear. Quick action is needed if the TAN exceeds the condemning limit.
Water ppm
Organizations such as the American Wind Energy Association, International Electrotechnical Commission, and the Danish Energy Authority all have condemning limits for water in wind-turbine gear oil.
As a general rule, it is accepted that water is detrimental in wind-turbine gear oil. These limits vary and acceptable levels can be <200 ppm to <500 ppm3 – depending on the organization. For one organization water >1,000 ppm4 is unsatisfactory and action should be taken to correct the situation. It is the industry trend to accept a lower ppm of water which is believed to be directly associated with longer gearbox life. Each organization cautions that water may have the following effects:
- Interrupts the oil-film thickness
- Precipitates additives
- Promotes foaming
- Promotes oxidation
- Causes seal hardening
- Causes paint peeling
- Causes some plastics to swell or shrink
- Causes corrosion
- Combines with sulphur to form
sulphuric acid - Causes rust that leads to abrasive wear
- Promotes metal fatigue
Laboratories may report water as a percentage or in parts per million. If an oil sample is reported as a percentage it may look insignificant but pay close attention because 0.10% may look small, while it is actually 1,000 ppm.
A study conducted by R.E. Cantley several years ago titled, “The Effect of Water in Lubricating Oil on Bearing Fatigue Life,” ASLE Transactions, 20 (3), 244-248, 1977, is still referenced today as Cantley’s formula:
L = (100/X)0.6
Where L = the % of rated life
and X = water contamination in ppm.
A plot for a range of X values appears in Estimated reduced fatigue life. Here we can see that 100 ppm water is associated with 100% rated bearing fatigue life. Higher ppm levels of water can shorten bearing life. There are also several Karl Fischer water tests available of which ASTM D6304C is the most accurate for wind-turbine gear oils. It is important to pay close attention to the amount of water in an oil sample and take action before it gets too high.

While reviewing ISO scale 4406:1999, it is important to understand that each time a code increases, the quantity range of particles doubles.
Particle counts and cleanliness codes
Evaluating particle counts in each category provides more information on their sizes and quantities, and should be used as a trending tool and not a one-time determining value. This test sees all particles and not just wear particles, so be careful not to think all particles are from wear. Other particles could be air bubbles, dirt, or cleaning rag threads.
Accuracy diminishes if the fluid color is dark or viscosity is high. If the oil is dark it may require dilution greater than one-to-one and possibly as high as an eight-to-one dilution factor (eight parts solvent to one part gear oil). If this is the case and given the cleanliness of the solvent the particle count should be adjusted to reflect a three number increase across the entire particle count. For instance, if the lab reported the particle count as 18/16/13, then the true particle count would be 21/19/16, which is eight times more particles than reported. This is because the solvent contains no particles and reduces the ppm count.
Cleanliness codes are based on a scale by the ISO called 4406:1999. There are three categories >4/>6/>14 of particles, and as an example a particle count of 21/19/16 may have particles associated with it in the ranges of 10,000 to 20,000, 2,500 to 5,000, and 320 to 640 respectively as can be seen on the Maximum & minimum oil-particle range chart. It is important to understand that each time a code increases, the quantity range of particles doubles. For example 19/17/14 has double the particles as 18/16/13.
The mystery of oil analyses is not such a mystery after all. It’s simply about applying certain rules or condemning limits to test results in order to visualize a clear oil analyses picture and understanding of the data.
Further reading:
- ISO IEC International Standard 61400-4, Edition 1.0, 2012-12
- AWEA Recommended Practice 101, First Edition May 6, 2013, Wind Turbine Gear Lubricant Flushing Procedures.
- Recommendation to Comply with the Technical Criteria of the Danish Wind Turbine Certification Scheme. August 2005.
- ANSI/AGMA AWEA 6006-A03. Design and Specification of Gearboxes for Wind Turbines. WPE
Filed Under: Bearings, Featured, Lubricants, News, O&M


Mr. Dinwiddle is correct in that oil analysis does not catch most wind turbine gear box failures. I would like to offer that the reason is that most gears fail due to excessive bending stress, resulting in subsurface cracks, that eventually result in catastrophic surface fatigue, This happens so fast it would be coincidental for routine oil analysis to catch it. One area that shows promise is installed oil sensors, which have the ability to capture real time OA data and recognize the larger particle discussed in the article.