
This 84-page document analyzes possible offshore wind farm locations in the state of California are examined, reference areas and potential wind plant technologies are selected, and the Levelized cost of energy (LCOE) to 2030.
Say hello to Daniel Laird, new director of NREL Wind Tech Center

Trained as a mechanical engineer, Laird began his career working with semiconductors.
NREL working with industry for higher levels of reliable wind generated power

Renewable Energy Laboratory (NREL) are working with industry partners toward an energy future that features significant levels of reliable, affordable, and sustainable wind energy.
NREL, Berkeley Lab unveil study: Prospective analysis of RE costs, benefits
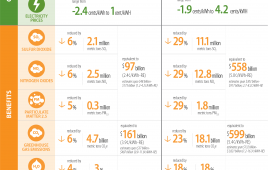
Relying on well-vetted methods, the study evaluates the RE costs, benefits, and other impacts of renewable energy used to meet future RPS demand growth from 2015 to 2050.
Clean energy is on the rise at home and around the world, in four charts

There’s a lot in this year’s Data Book to be excited about. Let’s take a look at four charts that tell the story of the clean energy revolution.
The renewable energy progress in 6 charts

The Energy Department recently released a report called “Revolution… Now,” which details five booming clean energy technologies, plus other promising pieces of clean tech.
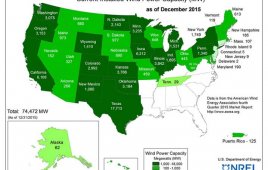
Computing America’s offshore wind energy potential

Our analysts calculate several different levels of the offshore resource assessment, each of which provides a more refined estimate of energy potential as more filters and assumptions are added.
Did you know Sept 10 to 18 is National Drive Electric Week?

This year’s Drive Electric celebration spans eight days from Sept. 10-18, with nearly 200 events across the country to familiarize people with the power, convenience, and widespread availability of electric vehicles.
Study shows U.S. Eastern Interconnection can accommodate more wind & solar power
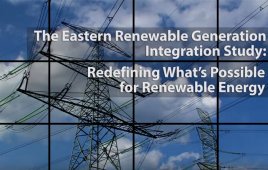
Editor’s note: The U.S. Department of Energy recently commissioned the National Renewable Energy Lab (NREL) to perform an Eastern Renewable Generation Integration Study (ERGIS), and the results are in. This scenario-based study was conducted on four wind and solar photovoltaic (PV) potential futures and predicted the associated operational impacts on the Eastern Interconnection. The Interconnection covers two-thirds…
What might be the financial impact of a new wind farm on your community? The Jedi tells

By Paul Dvorak | Editor Windpower Engineering & Development With interest in the wind industry growing nationwide, localities in which the farms are considered would probably like to know their financial impact. You could hire an accountant for a few guesstimates, but the Energy Department’s National Renewable Energy Laboratory might have better answer and sooner…
NREL readies new wind-turbine drivetrain for commercialization

The drivetrain sports a single-stage gearbox designed by Romax Technology, a medium-speed permanent-magnet generator, and a power converter developed by DNV Kema with high-efficiency modules developed by Cree (now Wolfspeed).
California’s Foothill Transit tests an electric bus
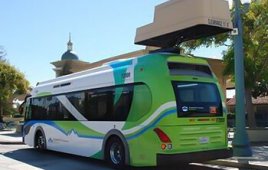
Foothill Transit has fully electrified one route in its service area and is investigating the feasibility of electrifying other routes as well.
NREL distributes round four funding for wind competitiveness improvement project

The Energy Department’s National Renewable Energy Laboratory is awarding four subcontracts under the fourth round of funding through DOE’s Distributed Wind Competitiveness Improvement Project.
New funding at national labs aims to partner with industry, strengthen clean energy manufacturing

TIR teams up senior lab technologists with industry professionals in “technologist pairs” for a period of up to two years.
Innovator: Palmer Carlin, NREL wind energy pioneer

The man who assisted in establishing what is now the National Wind Technology Center in 1977, now part of NREL, still comes to work at the Center most days.
NREL measures the public’s attitude about plug-in electric vehicles

A new report by NREL’s Mark Singer highlights what consumers really think about plug-in electric vehicles (PEVs) — including pure electric vehicles (EVs) and plug-in hybrid electric vehicles (PHEVs) — and what is needed to overcome widespread barriers to adoption.
NREL study shows great advantage of natural gas and EVs

Did you know that the average gasoline-powered vehicle produces roughly 4.8 metric tons of carbon dioxide per year?
Put a fence around It: Project finance explained

While it has certain limitations and requirements, project finance can be used to raise a large amount of funds in an efficient manner.
U.S. Department of Energy regional resource centers report on state of the wind Industry by region
Significant expansion of wind energy deployment will be required to achieve the goal of doubling renewable energy production in the United States by 2020.
Laminations for electric machines characterized for contact and bulk thermal resistance

The ability to remove heat from an electric machine depends on the passive stack thermal resistances within the machine and the convective cooling performance of the selected cooling technology.